Pitching in the Dark: From Kickoff to the Final Whistle
Complete FIFA World Cup 2026 Cyber Threat Intelligence Report

Inna Vasilyeva
Estimated dark web value of stolen streaming accounts during the World Cup
Estimated number of stolen streaming accounts available during the World Cup

Following on our pre-tournament and mid-tournament threat intelligence reports, the conclusion of the World Cup last weekend revealed an underground economy operating at an unprecedented scale.
While the group stage of the tournament established baseline bot operations, the knockout rounds and finals triggered a massive scale up in dark web credential trafficking.
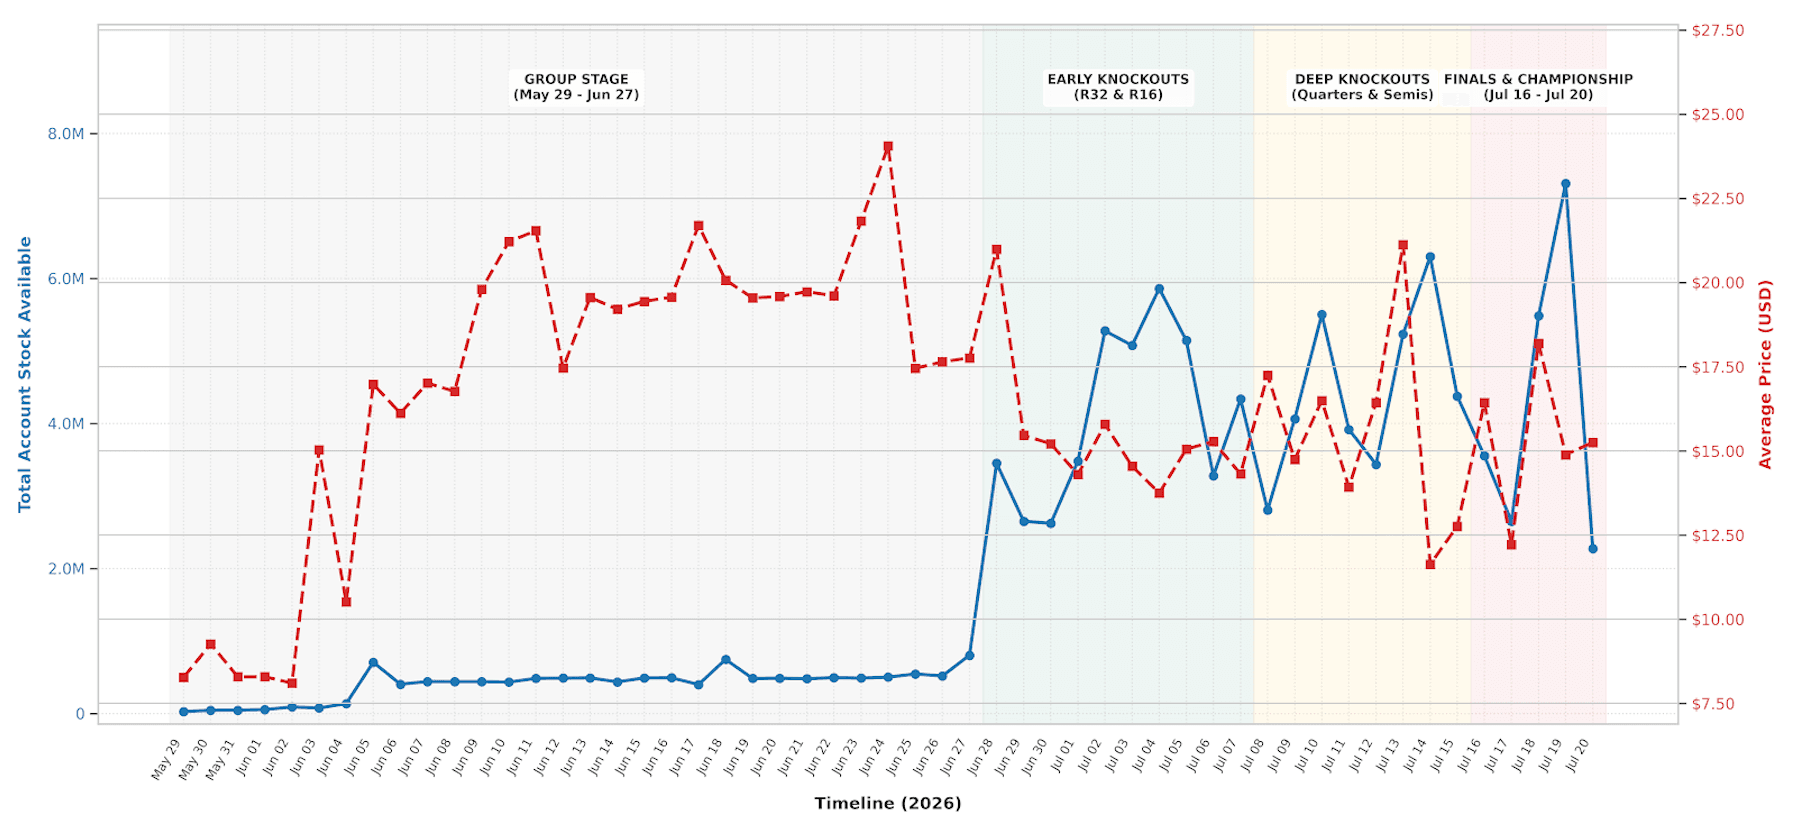
Across the entire 53-day monitoring window (May 29 – July 20, 2026), cybercriminals deployed automated credential stuffing botnets to compromise and trade ~110.2 million stolen streaming accounts across ~99,000 individual listings, yielding a cumulative black market revenue pipeline of $1.34 billion.
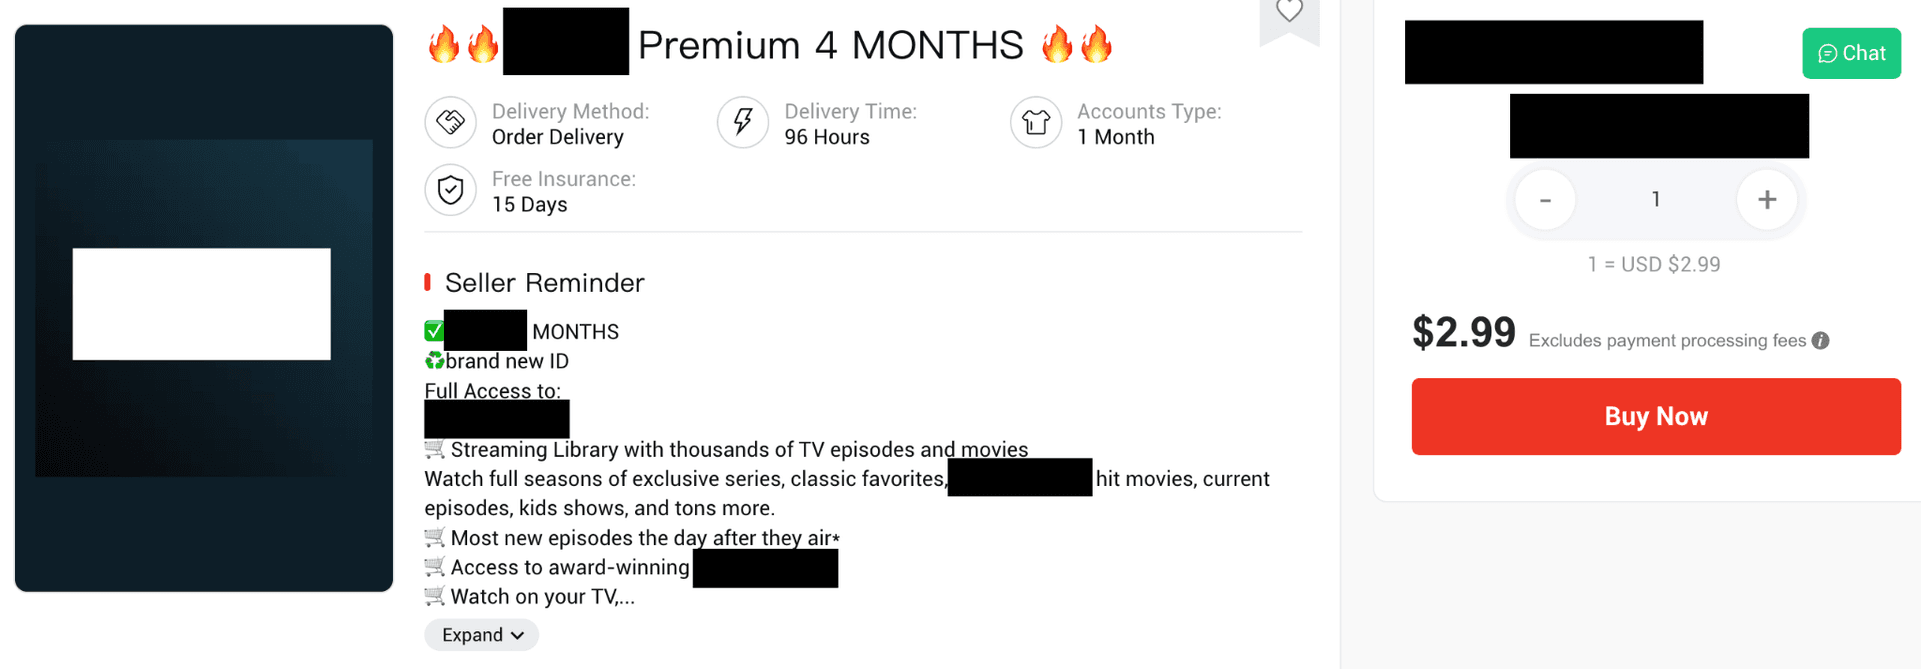

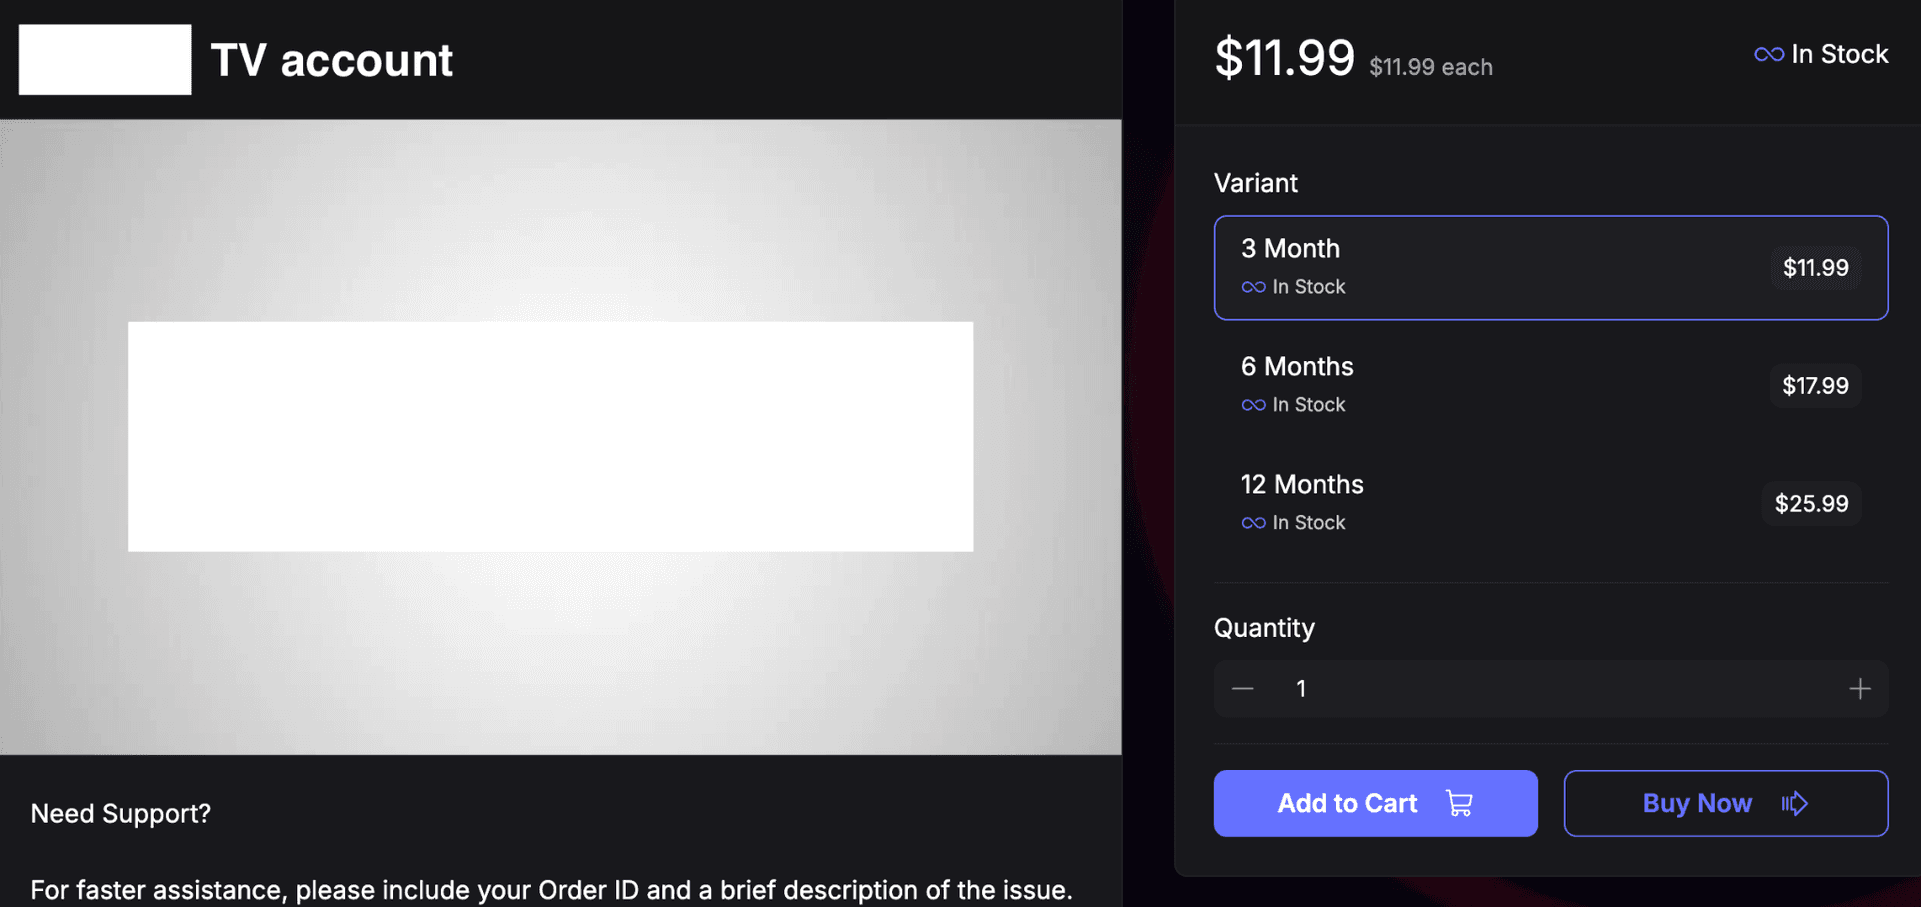
Stolen Streaming Accounts
Early Knockout Stage - Round of 32 & Round of 16 (June 28 - July 07)
The transition from single group matches to high-stakes single-elimination knockouts fundamentally altered the dynamics of the dark web economy for stolen accounts. As losing teams were eliminated, users’ interest in streaming remaining games skyrocketed, prompting threat actor networks to scale up inventory pools into the millions.
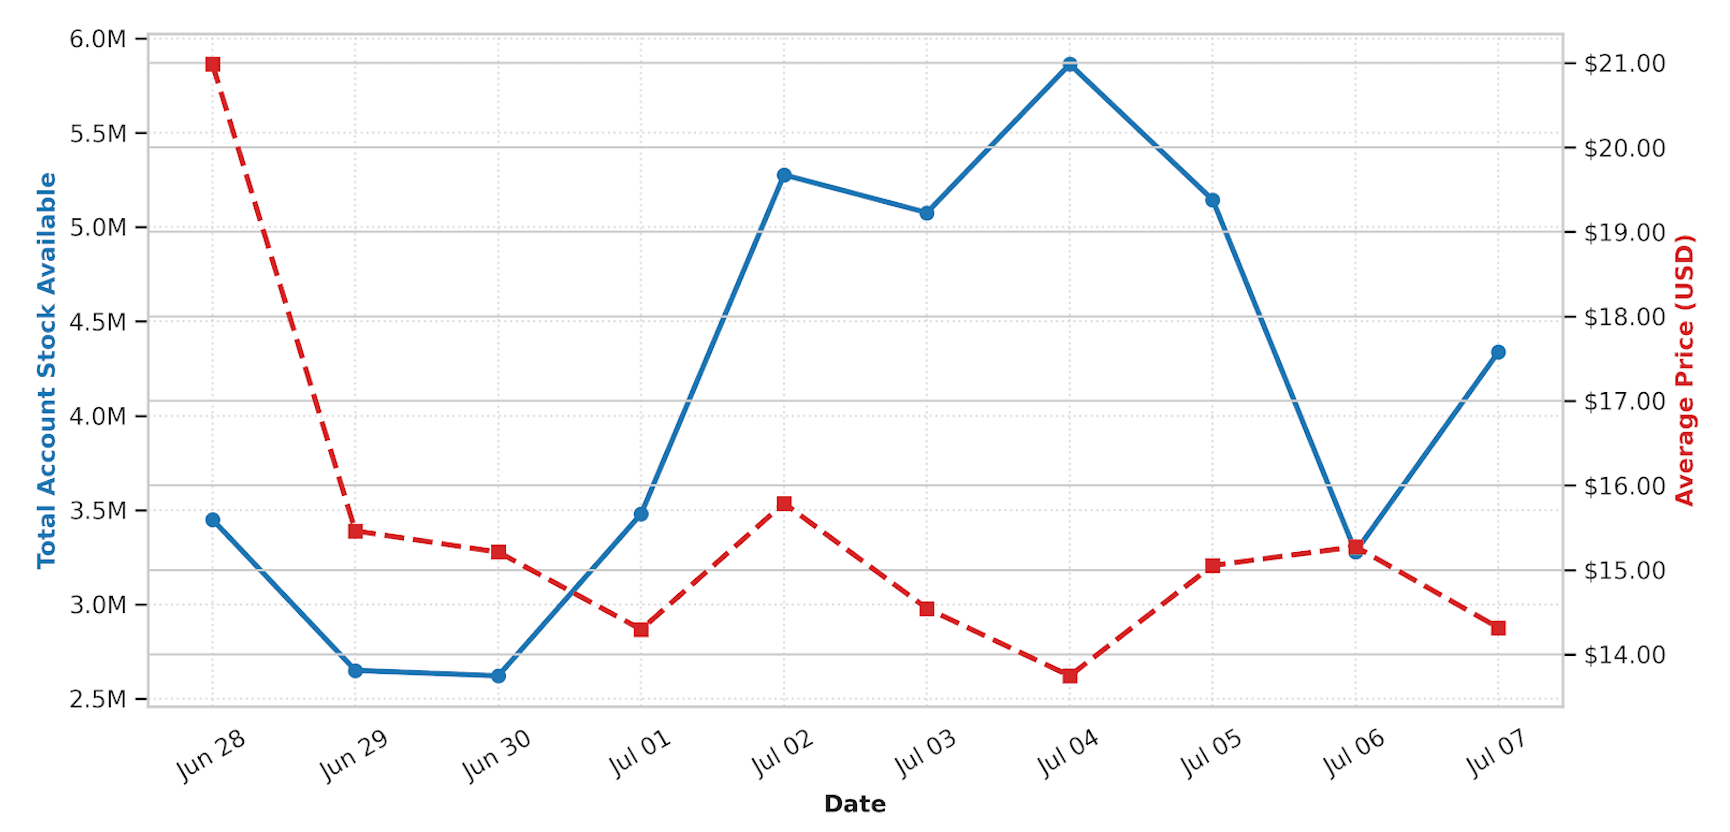
- Round of 32 Opening Spike (June 28): On the first day of single-elimination play, vendors artificially throttled the available stock of accounts and hiked listing prices to a phase high of $20.98 across 3,214 listings ($63.83 million single day potential value).
- Volume Escalation (July 02 – July 03): To accommodate casual fans seeking global coverage, daily inventory expanded from 5.28 million to ~5.86 million accounts.
- Round of 16 Opening Peak (July 04): Marking the Round of 16 kickoff, daily available stock reached 5,862,495 accounts ($56.17M single day value).
- Phase Sum: This phase generated 23,482 listings, holding 41,180,180 accounts with an updated market value of $466,127,261.16 (average price: $15.74).
Later Knockout Stage - Quarterfinals & Semifinals (July 08 - July 15)
With only top-tier international powerhouses remaining, this phase of the tournament recorded the highest average pricing intensity of the knockout stage ($16.24 phase average). Threat actor syndicates capitalized on region-locked broadcast paywalls to extract premium pricing.
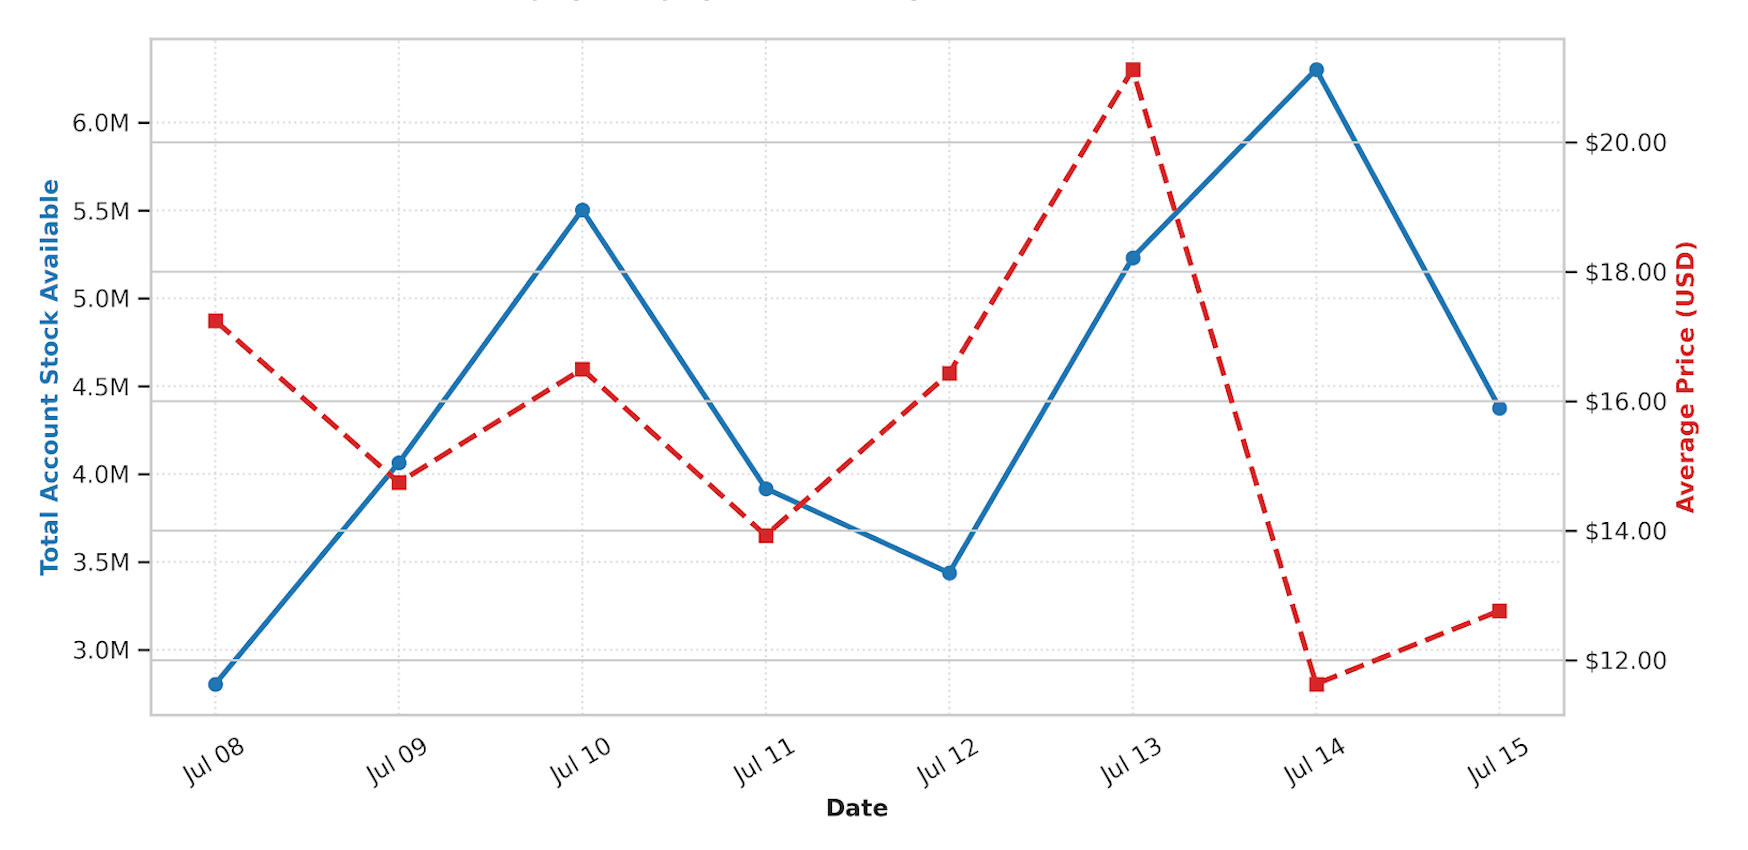
- Quarterfinal Valuation Peak (July 10): High demand matches like Spain vs. Belgium drove daily average listing prices up to $16.49 with 5,503,103 accounts in stock ($63.96 million potential value).
- The All-Time Pricing Apex (July 13): On the rest day immediately preceding the semifinals, cybercriminals executed an aggressive pre-game pricing maneuver. Average listing prices hit a playoff high of $21.12 across 3,842 listings ($88.09 million potential value).
- The Semi-Final Mega Dump (July 14): On the day of France vs. Spain, bot operators responded with a massive stock injection of 6,302,030 accounts in 24 hours ($60.44 million single-day value).
- Phase Sum: This phase accounted for 17,100 listings, 35,631,646 accounts, and $414,007,191.80 in market value.
World Cup Final & Post-Tournament Cooldown (July 16 - July 20)
The final phase of the tournament included the third-place match, the World Cup final, and the immediate post-tournament cooldown.
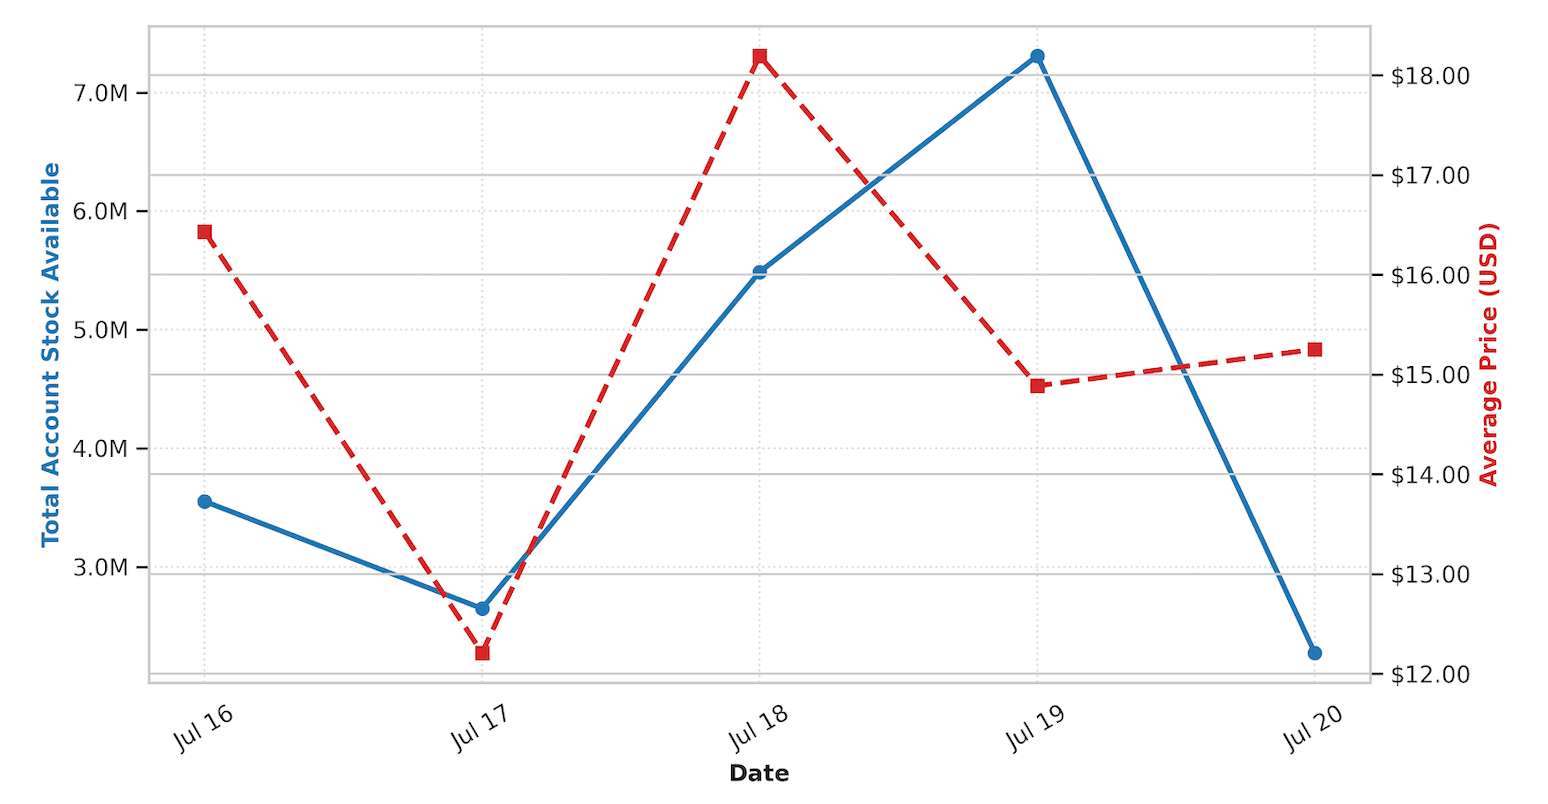
- Third-place Match Volume (July 18): France vs. England generated 3,877 active listings and 5,486,572 available accounts ($18.20 average price; $77.13 million potential value).
- The World Cup Final Historic Record (July 19 – Spain vs. Argentina): The championship match between Spain and Argentina triggered the largest single day credential distribution event in dark web history:
-
- Daily Active Listings: 4,153 listings (Tournament Single Day Record)
- Total Stolen Stock Available: 7,310,080 accounts (All-Time Single Day Stock Record)
- Single-Day Black Market Value: $79,199,663.91
- Post-Tournament Unwind (July 20): Following Spain’s victory, active stock contracted rapidly to 2,274,709 accounts as threat actors dismantled temporary proxy infrastructures.
- Phase Sum: This final phase recorded 13,233 listings, 21,270,810 accounts, and $242,035,340.71.
Group Stage vs. Knockout Stages and Finals
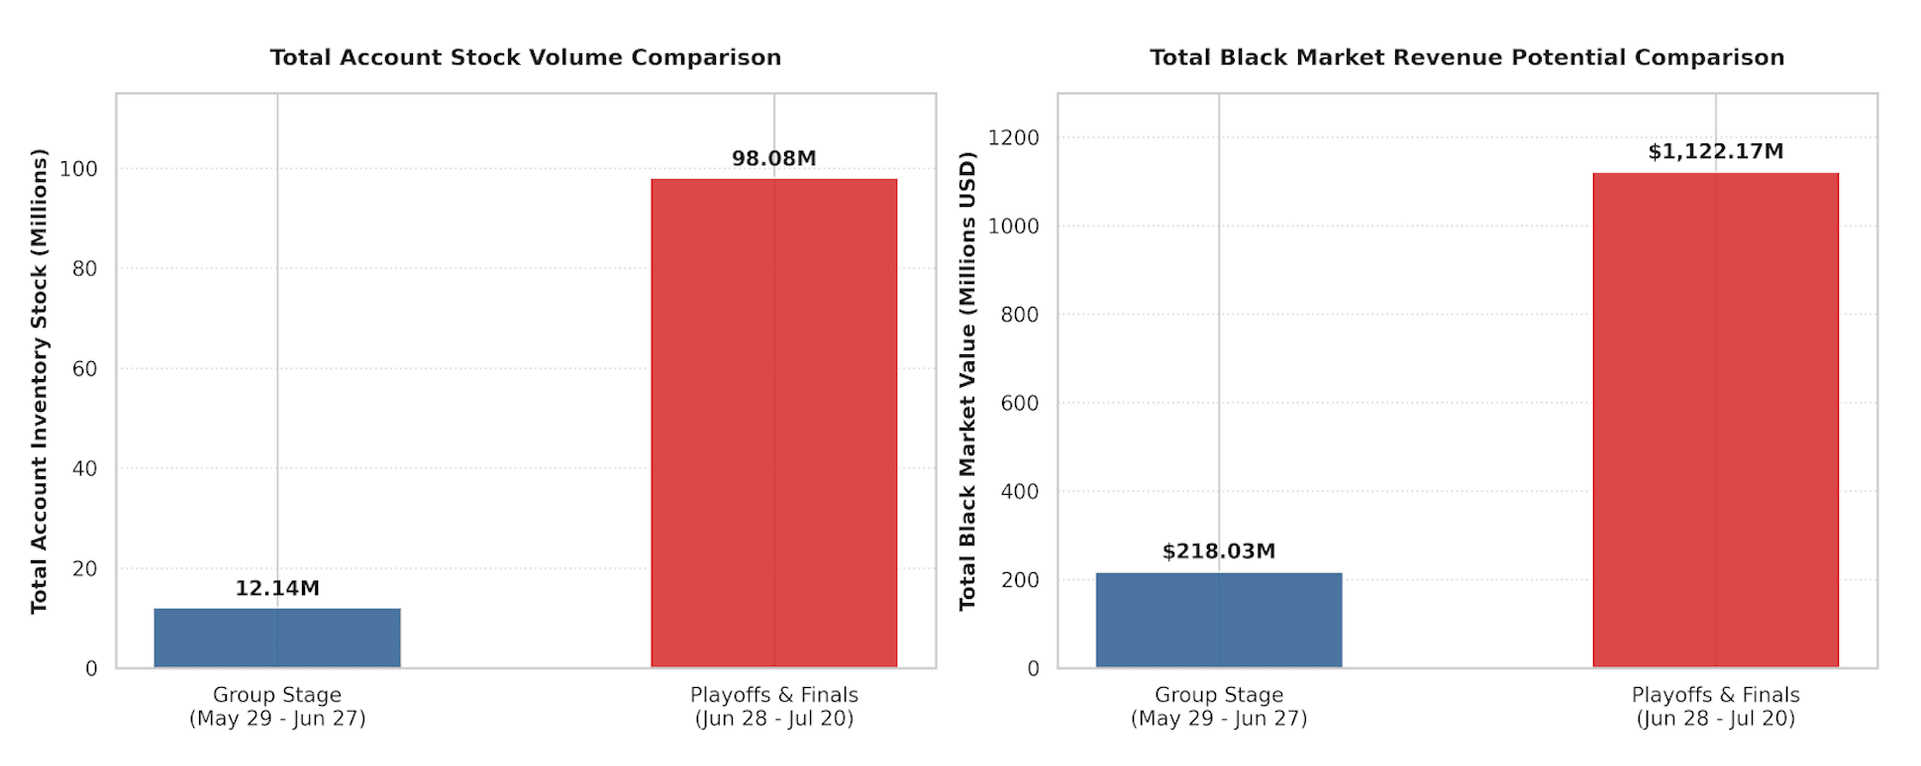
A comparative analysis between the Group Stage with pre-warming period (May 29 – June 27) and the Playoffs & Finals (June 28 – July 20) reveals a massive structural evolution in cybercriminal operations.
Key Insights:
- Exponential Inventory Scaling (+708% Stock Expansion): While the Group Stage maintained an average stock pool of ~405,000 accounts/day, the Knockouts averaged over 4.26 million accounts/day. Threat actors shifted from selective harvesting to continuous, automated mass validation injections.
- Revenue Multiplication (+415% Value Increase): Potential illicit market value scaled from $218.03 million during the Group Stage to $1.12 billion during the Playoffs/Finals, illustrating how fan willingness-to-pay compounds during elimination rounds.
- High Volume Supply Shift: Inventory surged 8.1x during the knockouts, threat actors adjusted entry level pricing slightly (averaging $15.93) to capture high volume, quick turnaround sales while keeping single day revenue between $60 million – $110 million per match day.
Threat Actor Conversation Trends
An analysis of ~16,000 Telegram messages across 212 unique threat actor channels captured during the World Cup (spanning May 29 to July 21, 2026) shows how the cybercriminal community engaged with the tournament.
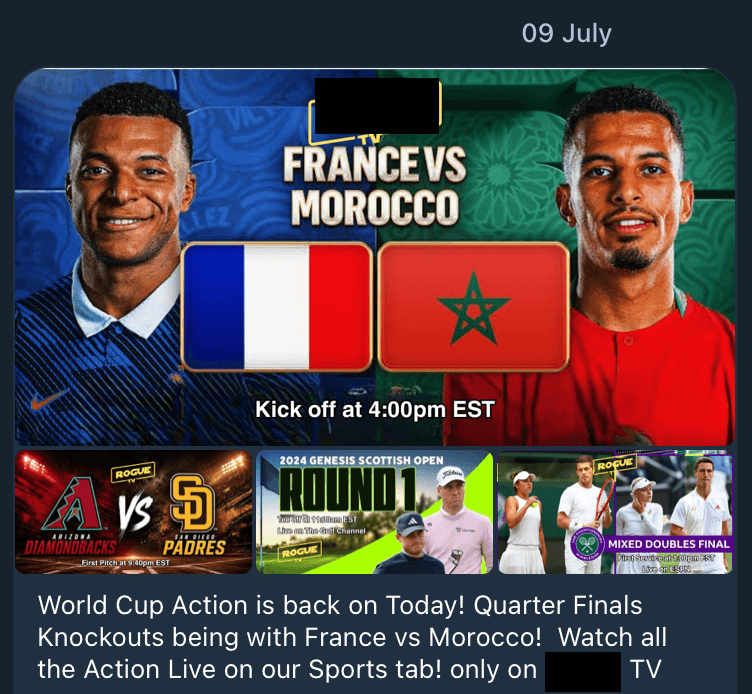
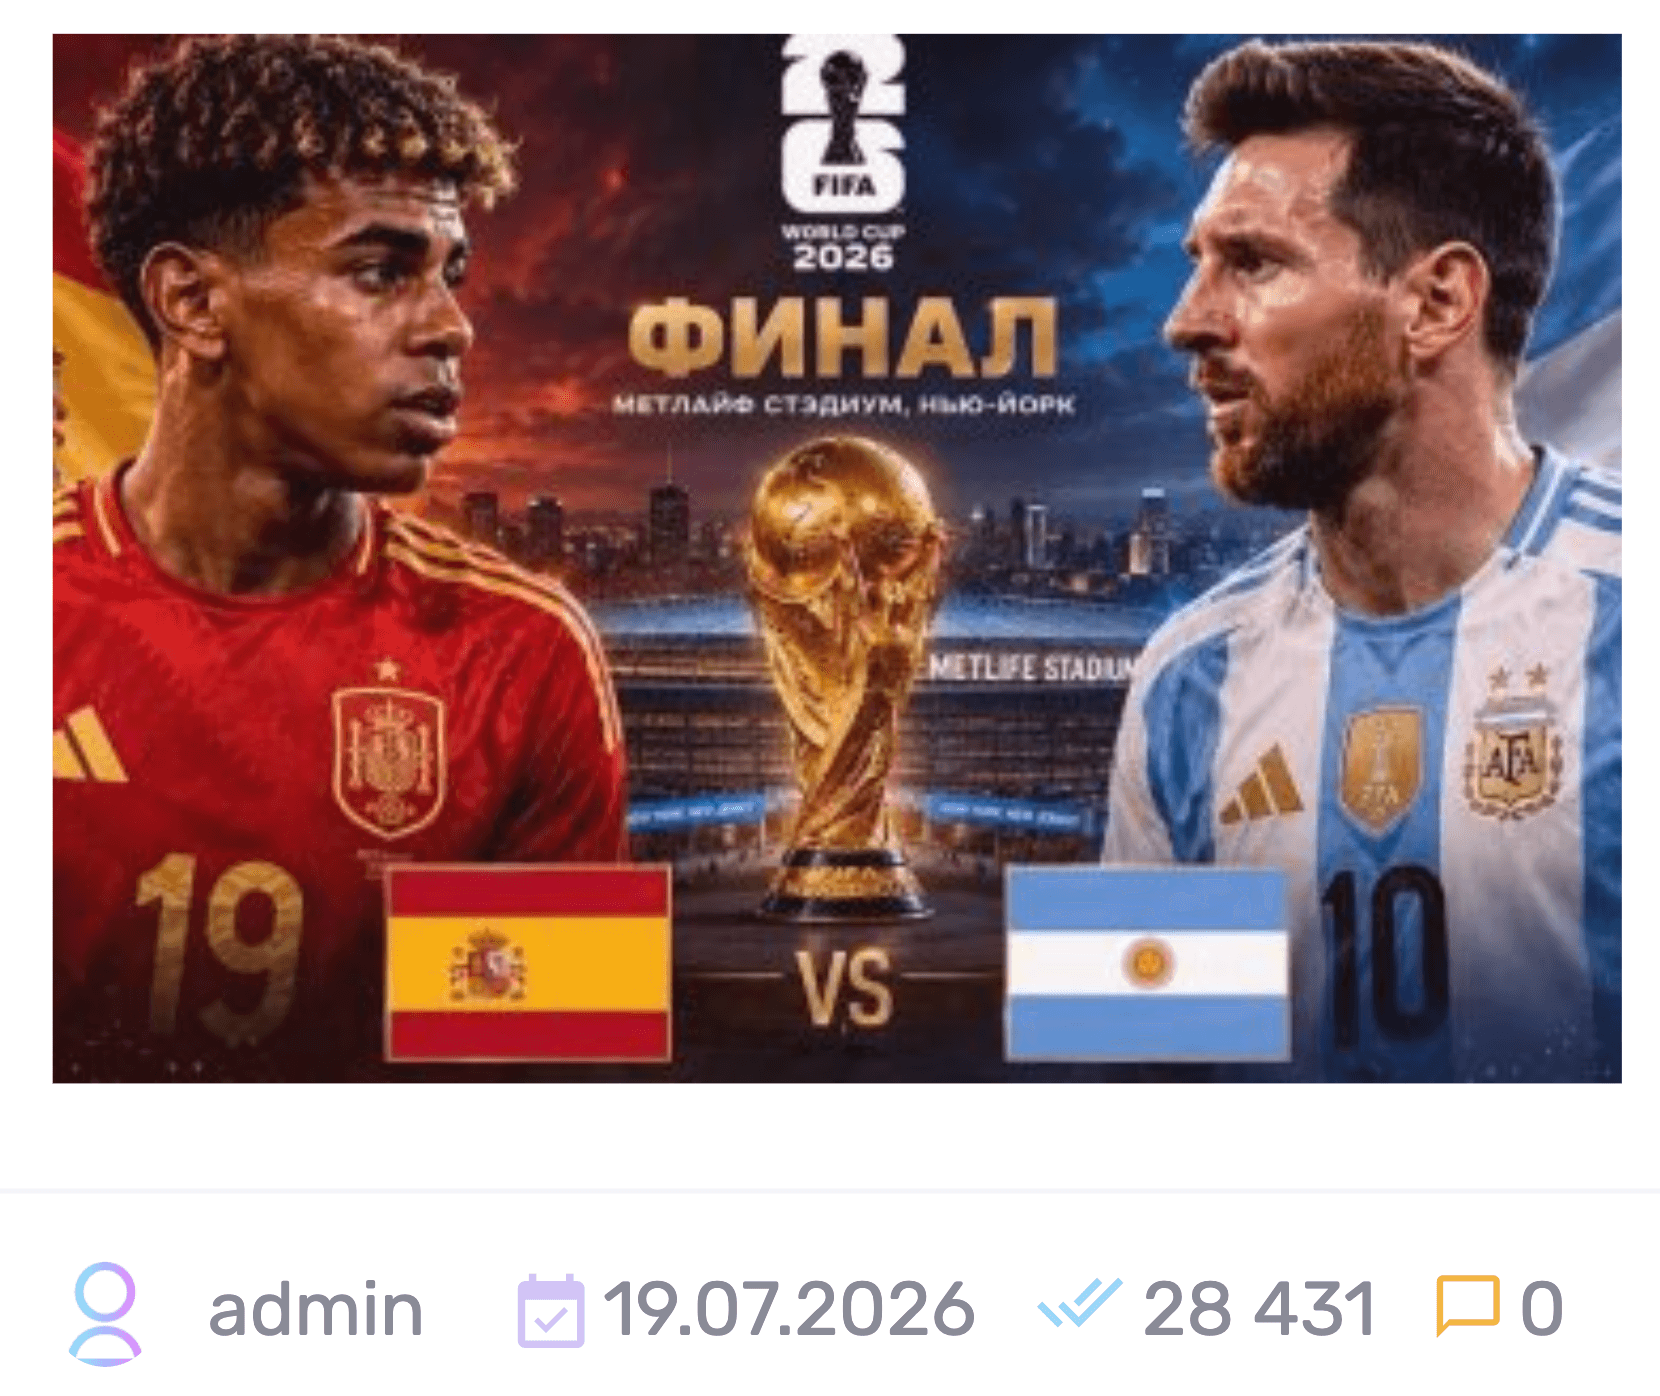
Activity was driven by three primary motives:
- Solana Memecoin & Crypto Speculation (59.01%): High-frequency automated price alerts, bounties and token launches tied to match events and team performances.
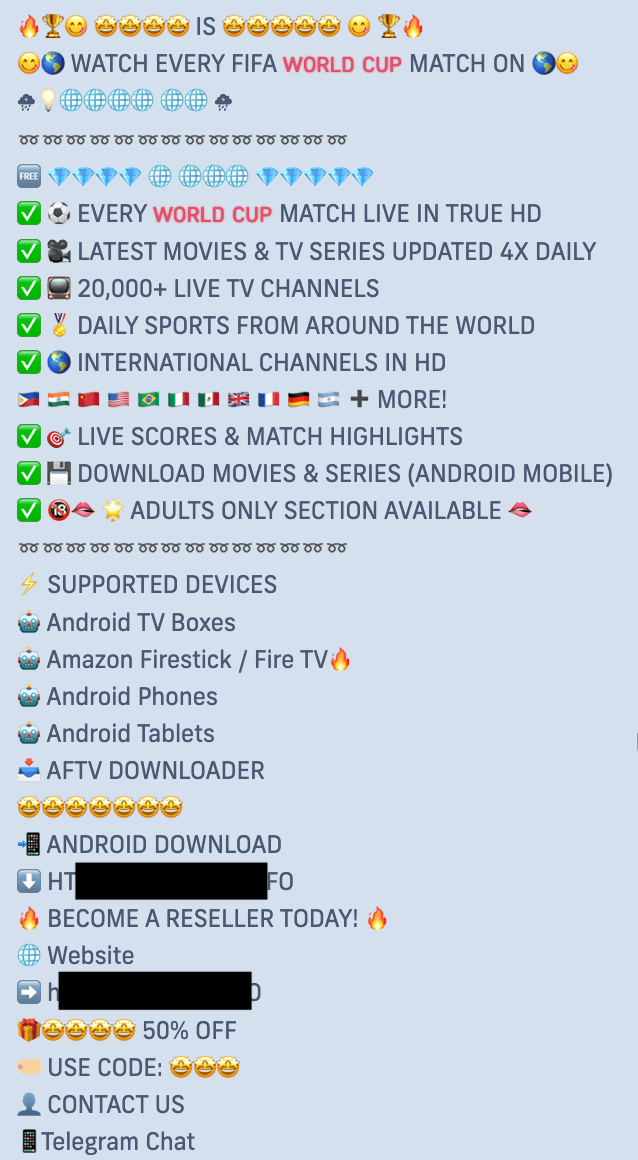
- Pirated Live Streaming & IPTV Demands (15.92%): Spikes in link requests during major playoff matches and the final.
- Automated Marketplace Promotions & Ticket Sales (12.08%): Discount coupon drops, commercial bot announcements and ticket vending chatter concentrated heavily around the group stage.
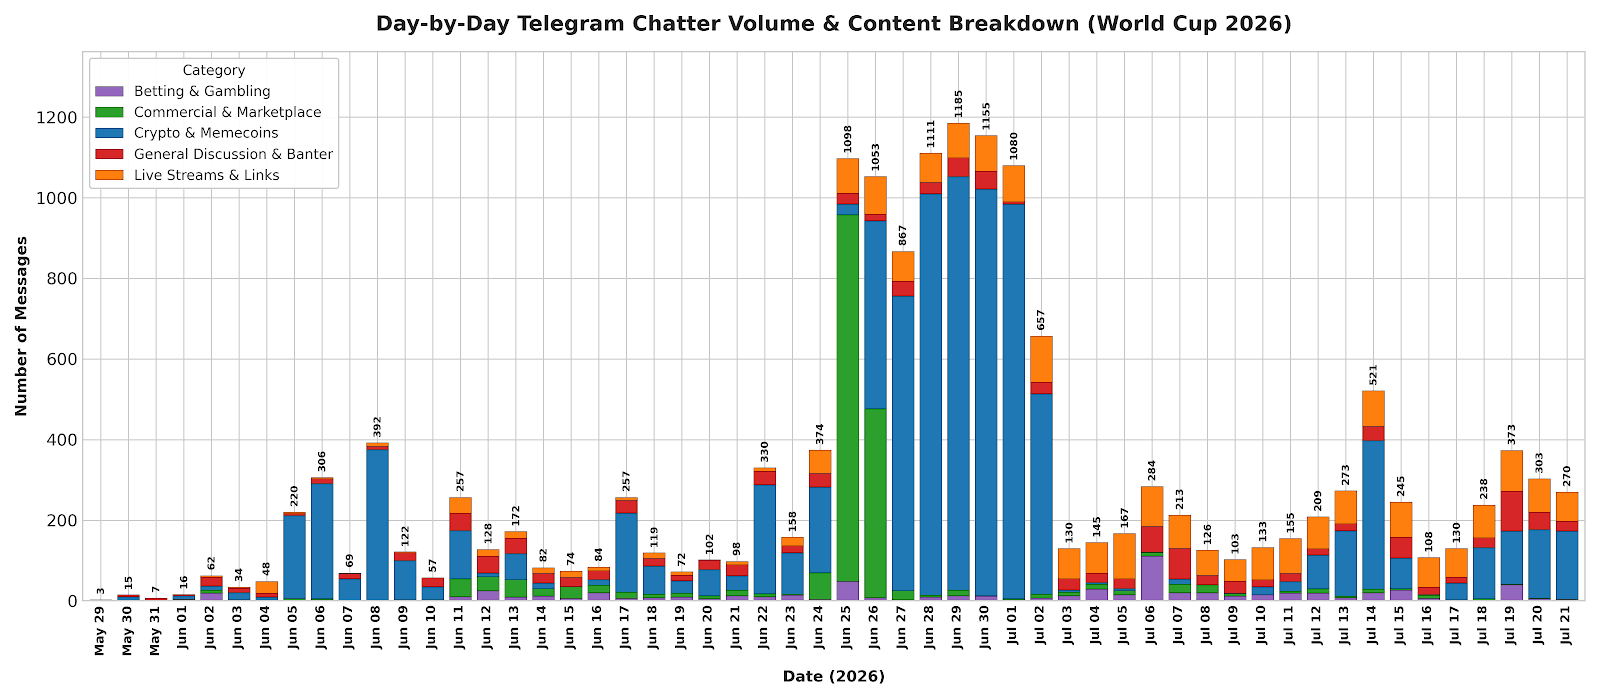
The chatter dataset is categorized into 6 distinct tournament phases, shifting from speculative crypto token tracking to heavy automated spam campaigns and eventual IPTV/piracy streaming promotions:
Tournament Stage | Date Range | Total Messages | Volume Share (%) | Primary Driver/Narrative |
|---|---|---|---|---|
Pre-Cup | May 29 - June 10 | 1,351 | 8.45% | Ticket resale, early tournament hype and initial memecoin drops. |
Kickoff | June 11 | 257 | 1.61% | Tournament kickoff, opening match commentary and stream seeking. |
Group Stage | June 12 - June 27 | 5,068 | 31.69% | Major commercial promo surge (coupon codes) and group standings banter. |
Playoffs | June 28 - July 18 | 8.368 | 52.33% | Peak volume period driven by high-stakes matches, stream links and crypto bounties. |
Final | July 19 | 373 | 2.33% | Highest proportion of organic discussion, stream sharing and live betting odds. |
Post-Cup | July 19 - July 21 | 573 | 3.58% | Post-tournament recaps, replay stream links and crypto market cooldown. |
Chatter volume shows dramatic increases corresponding with major match days and milestone events, with multiple significant peaks:
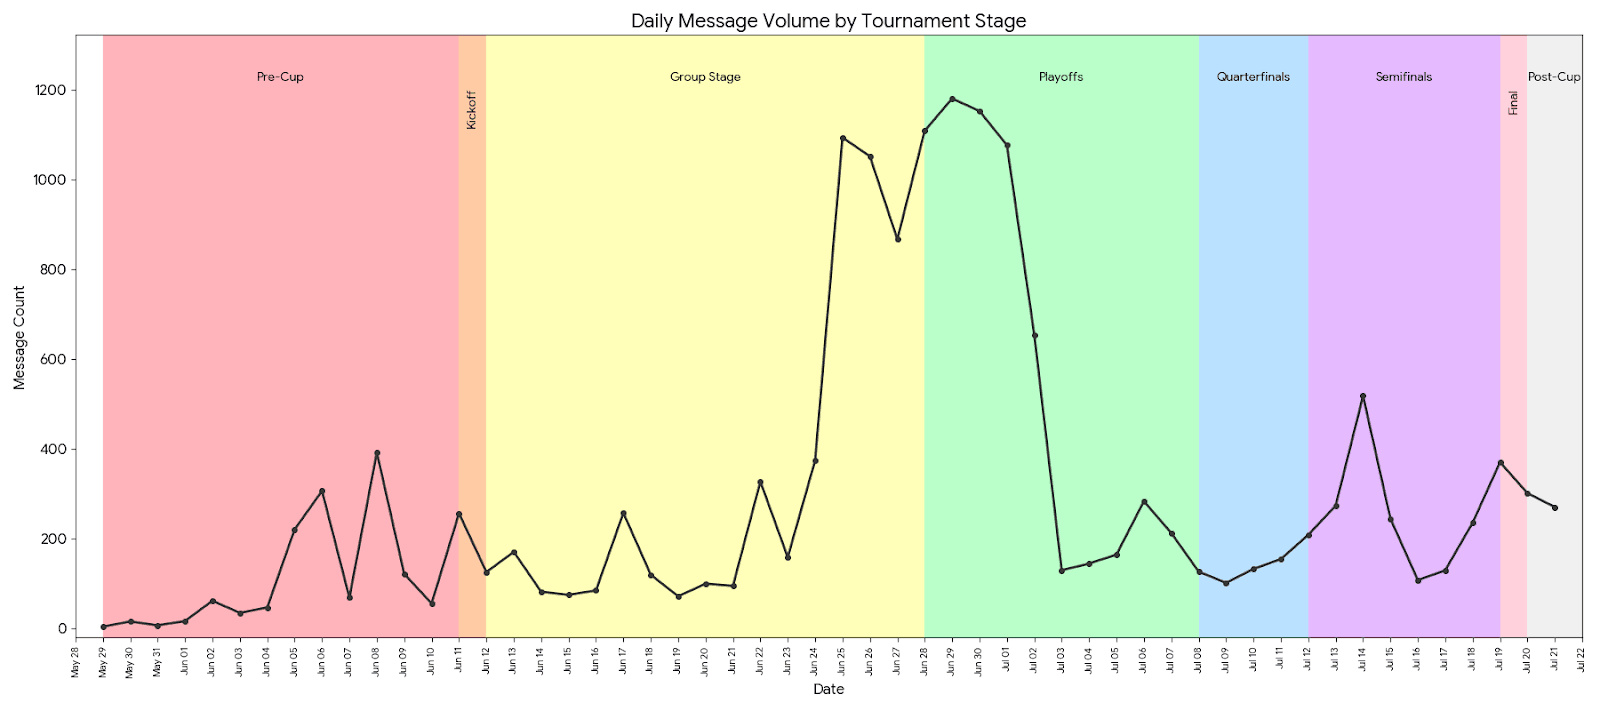
Pre-Cup Stage (May 29 – June 10): Chatter started slowly but saw multiple early peaks, particularly on June 8 (392 messages), as anticipation for the tournament built.
Kickoff (June 11): The official start date triggered a notable surge in conversation (256 messages).
Group Stage (June 12 – June 27): Activity remained highly volatile but moderate for the first two weeks before exploding during the final three days of the stage, crossing the 1,000-message threshold as teams fought to advance.
Playoffs (June 28 – July 07): The momentum from the group stage carried into the playoffs, marking the highest sustained peak of the entire dataset. Chatter held steadily above 1,000 daily messages for four days before dropping off rapidly in early July.
Quarterfinals (July 08 – July 11): Conversation flattened to a surprisingly low baseline, remaining relatively quiet (100–150 daily messages) compared to the massive spikes seen earlier.
Semifinals + Bronze Game (July 12 – July 18): Chatter picked back up with a massive single-day spike of 518 messages on July 14, followed by quieter days leading into the championship.
Final (July 19): The culminating match saw a strong resurgence in activity (370 messages).
Post-Cup (July 20 – July 21): Discussions lingered in the aftermath, with numbers gradually trailing down but remaining well above the pre-cup baseline.
Stolen Ticketing Accounts
Our analysis of availability and pricing of illicitly traded ticketing accounts for the World Cup across 2 major ticketing services on the dark web spans 54 days, from the lead-up to the tournament on May 29, 2026, through post-cup on July 21, 2026.
Across 657 individual listings, a cumulative total of 330,422 ticketing accounts were made available for purchase. Sellers highly standardized their supply. The vast majority of accounts were sold in specific, rigid bulk batches.
The average price for an account listing was $39.43, but this is heavily skewed by premium outliers. The median price was just $5.00, indicating that the bulk of the accounts are low-tier, likely standard queue-bypass bots or unverified profiles.
The maximum price recorded was $425.00, which appeared frequently enough to establish a distinct, high-value tier. These accounts are sold with guaranteed pre-loaded funds or VIP access.
Supply vs. Demand Constraints
Analyzing the interaction between stock availability and pricing reveals distinct market behaviors corresponding to the tournament’s progression:
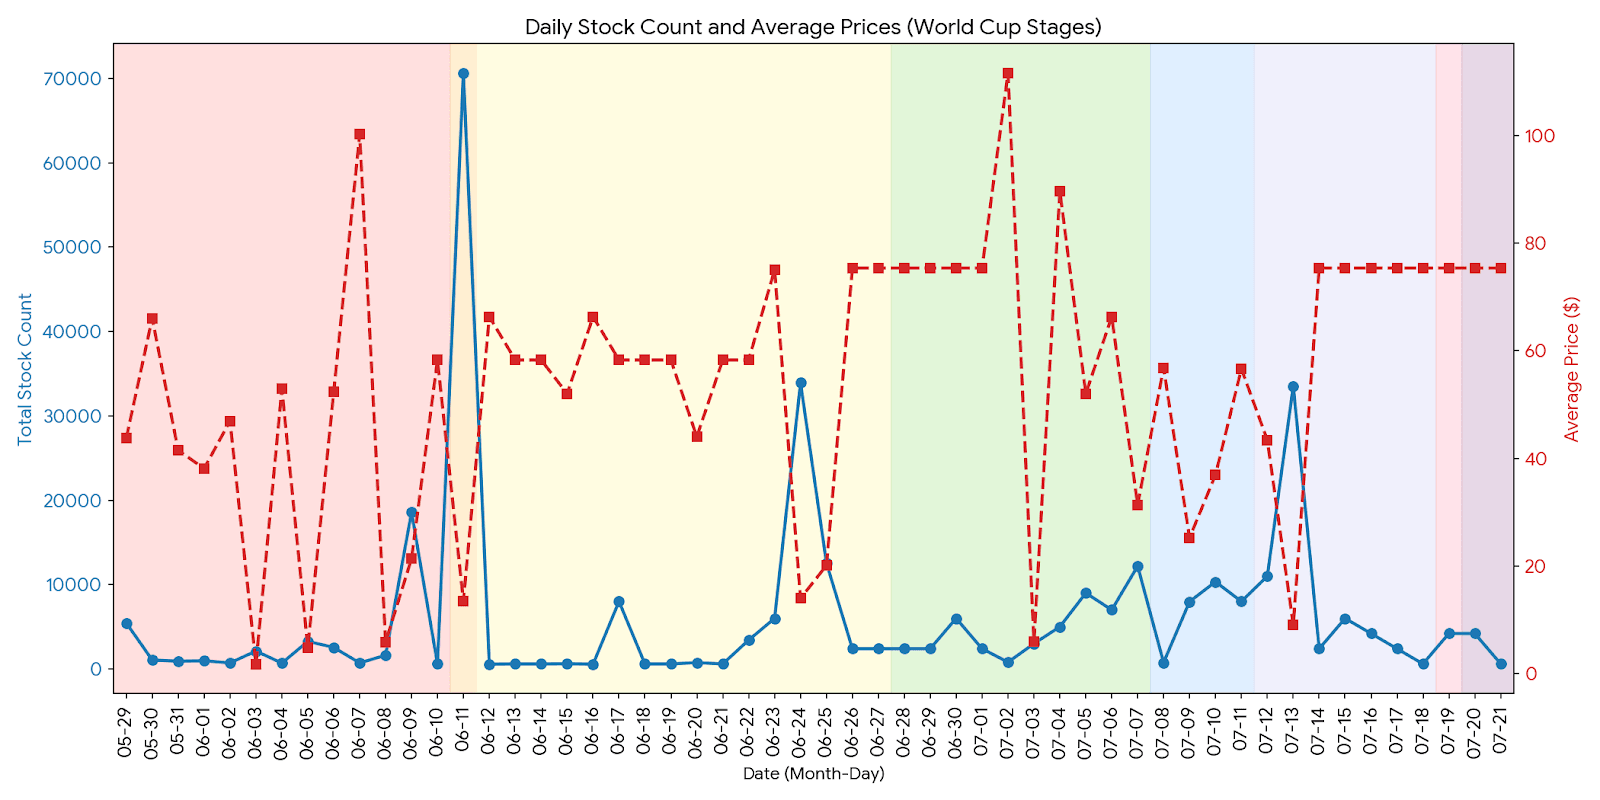
- Pre-Cup Stage (May 29 – June 10): The market begins with relatively restricted stock, averaging around 3,020 accounts available per day. Prices are highly volatile as sellers test the market, with the average hovering near $41.
- Kickoff (June 11): The market experiences a massive single-day flood of accounts, hitting an absolute peak stock of over 70,000. Consequently, the oversupply crashes the average price to a tournament low of $13.50.
- Group Stage (June 12 – 27): Account availability sharply drops and stabilizes, averaging 4,635 per day. As the initial glut clears, the average price steadily recovers into the mid-$50 range.
- Playoffs (June 28 – July 07): As elimination matches begin, demand surges. Sellers maintain a relatively low daily stock (averaging ~5,019) to drive up scarcity, pushing the average price to $65.83.
- Quarterfinals (July 08 – 11): A slight influx of accounts is observed during this window, bumping the average daily stock to 6,768. This eases market pressure slightly, bringing the average price down to $43.91.
- Semifinals + Bronze (July 12 – 18): Another significant batch of accounts is dumped mid-stage, pushing the average daily stock up to 8,588. Despite the extra stock, the gravity of the matches pushes the average price back up to $61.32.
- Final (July 19): On the day of the championship, stock levels drop significantly to 4,200. The average price spikes and locks in at $75.36.
- Post-Cup (July 20 – 21): Following the tournament, the remaining stock rapidly dries up, averaging just 2,400 accounts. Interestingly, sellers hold the final listing prices firm at $75.36.
The dark web marketplace for these ticketing services operated with sophisticated, highly responsive supply-and-demand mechanics. Sellers deliberately throttled supply during high-stakes elimination rounds to maximize profits on premium accounts, while occasionally flushing the market with massive batches of cheap, low-tier accounts during early-stage transitions.