
HUMAN servers run in a multi-provider multi-region setup. Most of the production services (Apache Kafka, Redis, MongoDB, HAProxy, PerimeterX services and more) run independently and isolated in each region, therefore most of the monitoring and alerting is done per service per region. While aggregations are sometimes in use, it is a rare practice.
We started with DataDog as our monitoring tool, and it provided us with an excellent solution. However, when we started to grow, the per host pricing model became too expensive, and we decided to test some open-source monitoring tools. Prometheus looked like it could be the ultimate solution to our needs.
First phase
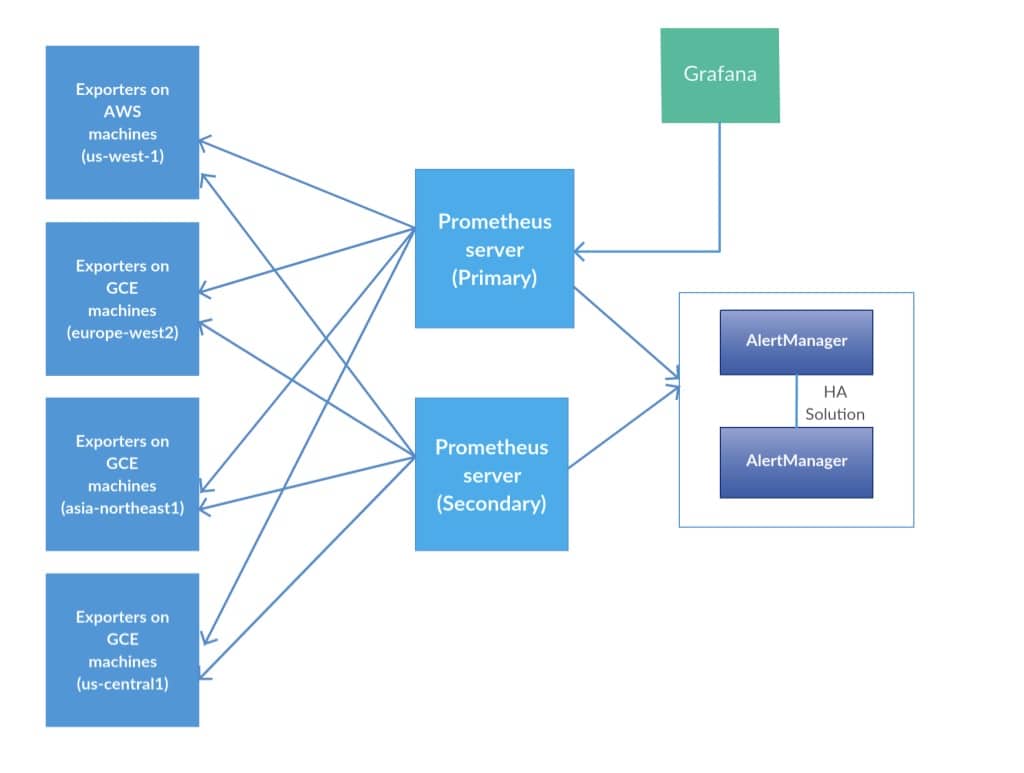
Out first solution was based on a single Prometheus server collecting data from all of our targets over all regions, using GCE service discovery. We used AlertManager with its own high availability solution as our alert handler and Grafana as the UI monitoring tool.
In fact, we had two Prometheus servers, both running the same configuration, for high availability. Both were scraping the same targets. A simple script monitored the /alive call of the primary server, and in case of failure, it switched Grafana to work with the data source of the secondary server.
In Grafana, we had the following configuration:
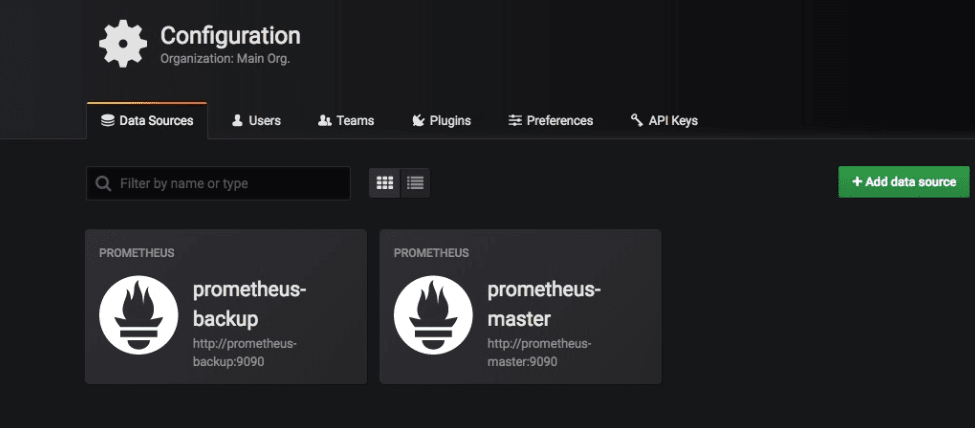
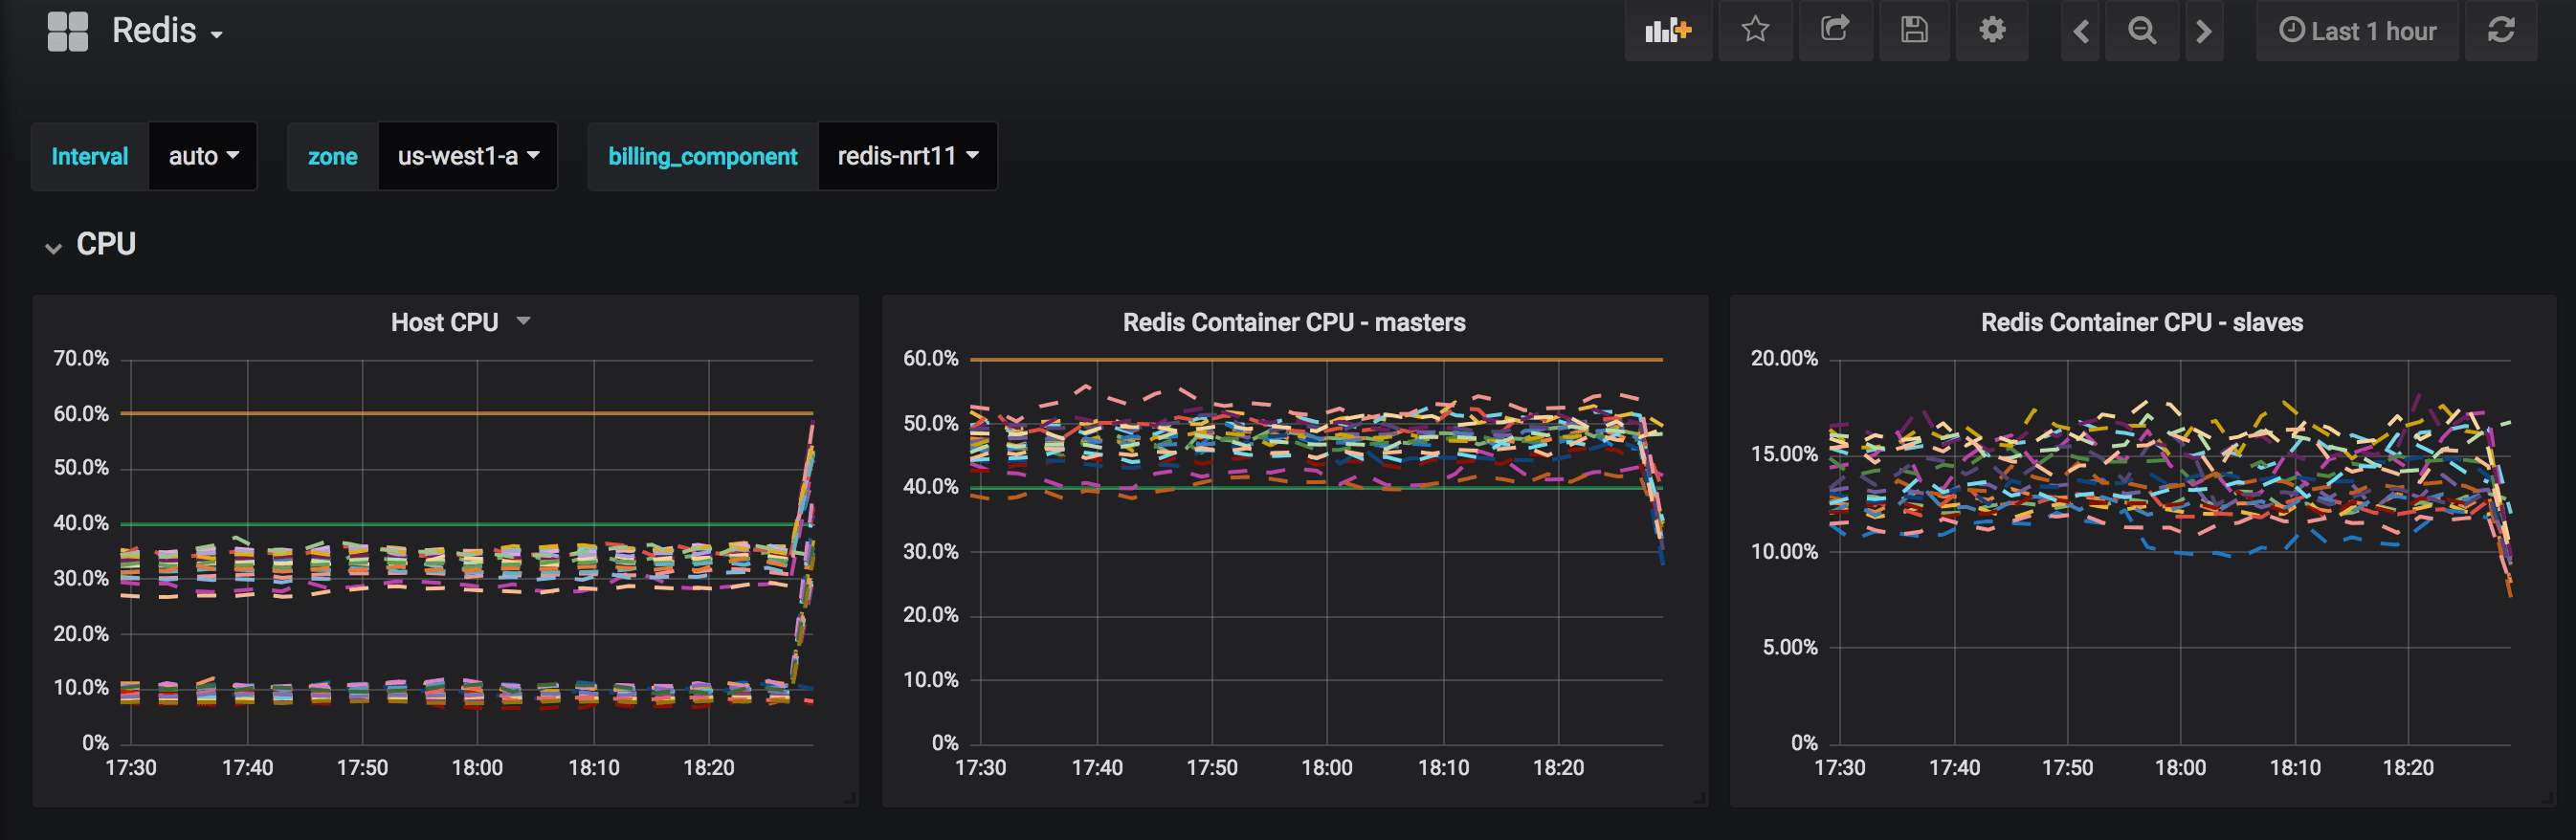
In most of the dashboards we have the zone/region variable template, specifying which POP we are querying.
In the first iteration we gave each Prometheus server 4 cores and 26GB of RAM. This worked great when we had around 200 machines reporting to Prometheus, but as more machines joined the party, too many active time series were being written, and RAM became a bottleneck resulting in Prometheus spitting this scary message: “Storage needs throttling. Scrapes and rule evaluations will be skipped”. So we upgraded the server as we grew until we got to the point where our server had 12 CPUs and 102GB of RAM to monitor ~1200 machines.
Scale up is fine, but scale out is better. Our approach for scaling out had the following properties:
- All dashboards should support multi POP selection – one dashboard for each service.
- Aggregate dashboards should be supported, but they are rare.
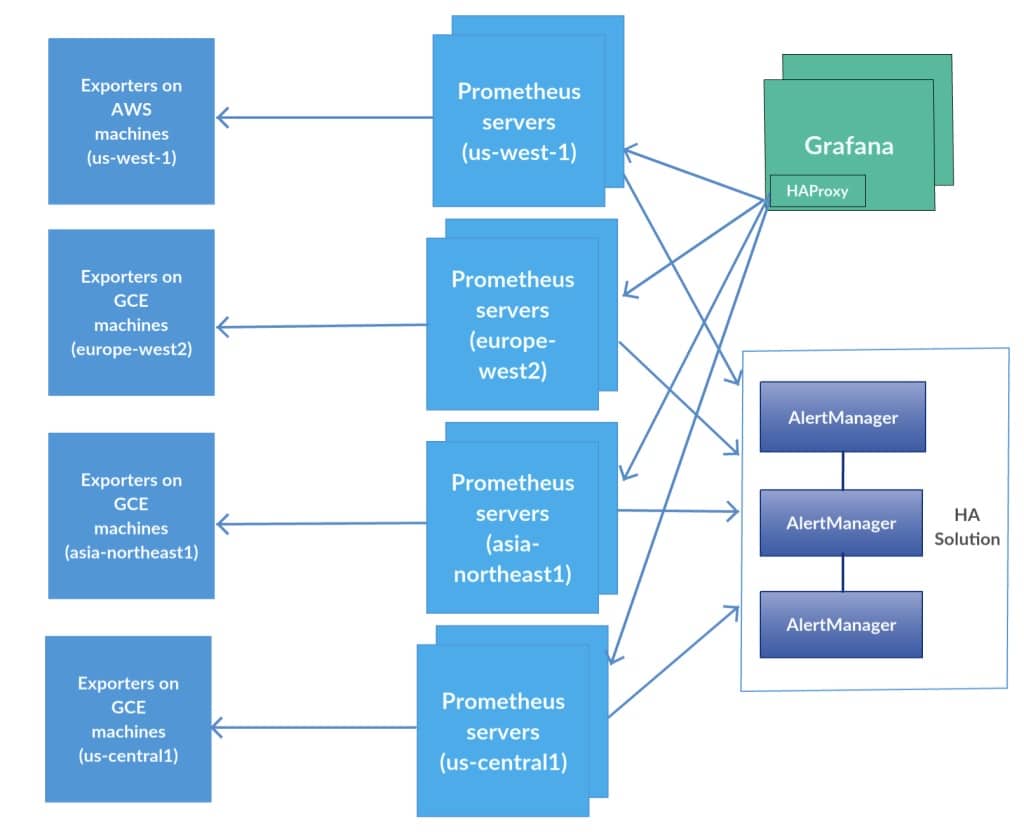
The multi-pop solution
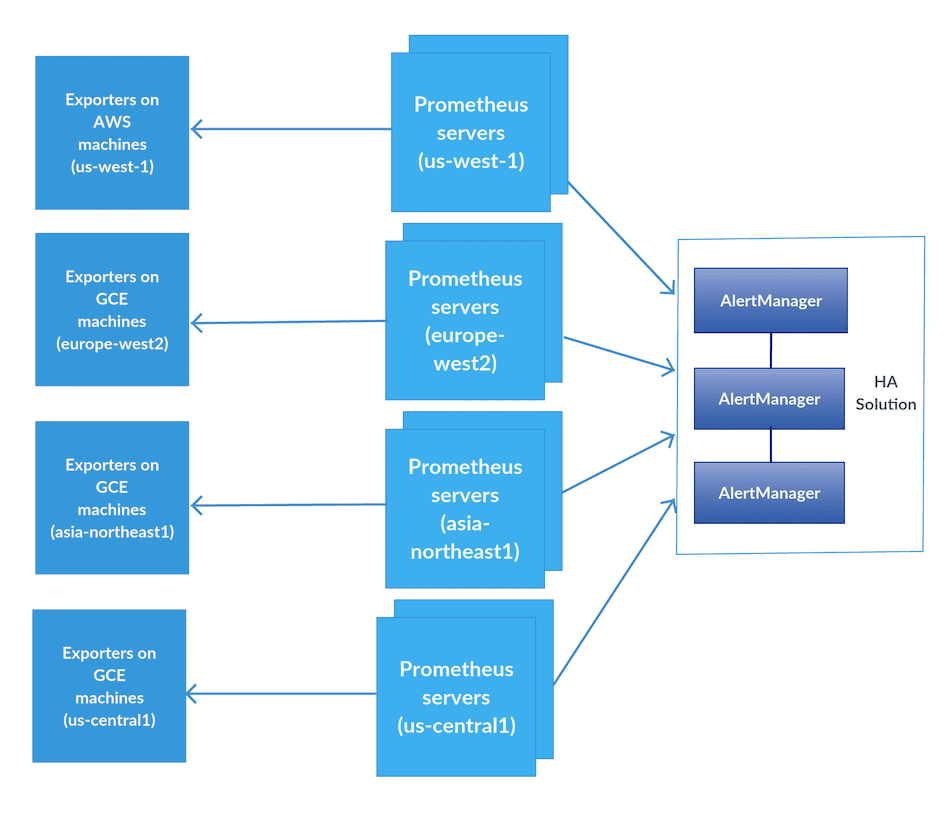
We created Prometheus servers in each POP scraping only the machines within its own region. For redundancy, we created two Prometheus servers in each POP. We kept the AlertManager HA built-in solution, so now all of the AlertManagers are communicating with each other across all regions. At this time, we also upgraded Prometheus to version 2.1 which improved performance and storage utilization.
This decreased the load on each Prometheus host in each region fourfold on average, so we could continue the rollout.
On the Grafana end, an HAproxy sidecar container which is located on each Grafana server is querying all relevant Prometheus machines in each POP, and the Grafana data sources are pointing to these ports:
frontend fe-us-central1<br> bind *:9091<br> ...<br> use_backend be-us-central1<br><br>frontend fe-asia-northeast1<br> bind *:9092<br> ...<br> use_backend be-asia-northeast1<br><br>frontend fe-europe-west2<br> bind *:9093<br> ...<br> use_backend be-europe-west2<br><br>backend be-us-central1<br> balance roundrobin<br> server prometheus-us-central1-a-1 prometheus-us-central1-a-1.internal:9090<br> server prometheus-us-central1-b-2 prometheus-us-central1-b-2.internal:9090<br><br>backend be-asia-northeast1<br> ...<br><br>backend be-europe-west2<br> ...We also created multiple Grafana hosts with stickiness, so the final solution looks like this:
Grafana challenges with multiple datasource configuration
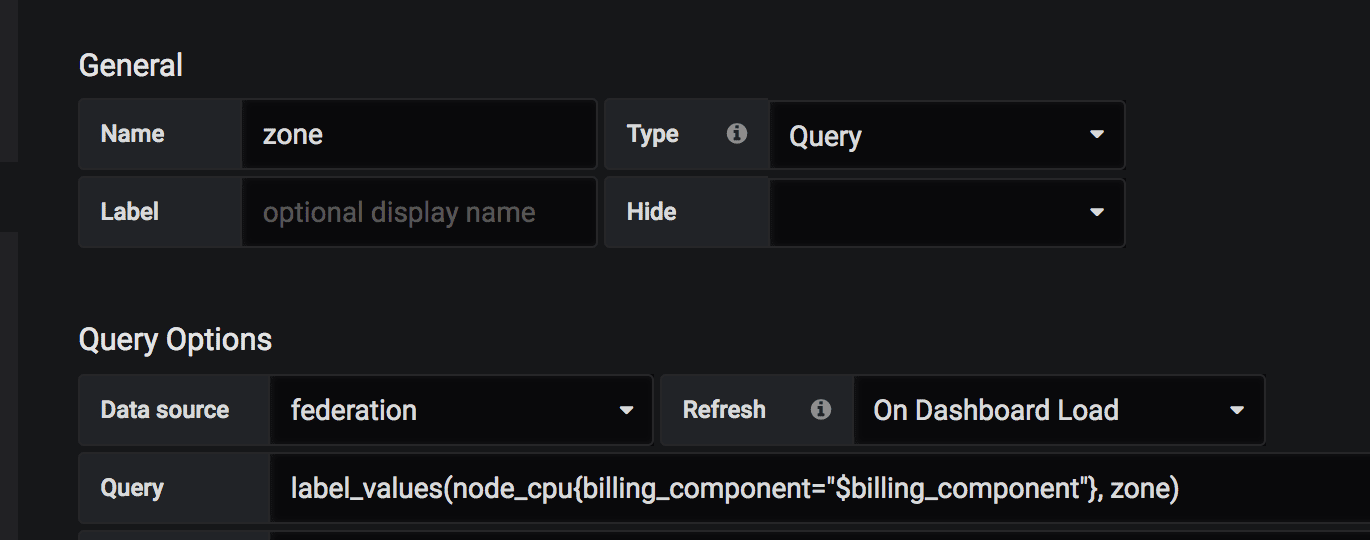
The first challenge we had to deal with is that Grafana doesn’t support querying multiple datasources in the variable section. The solution for that is the Prometheus federation approach, which can include all relevant labels by querying small samples from all Prometheus servers. This is also a good solution for aggregated alerts and because we don’t have many of them – we can keep the federation server relatively small. So we created two Prometheus servers (again, redundancy) with federation configuration. The following is an example of how we pull all zones from all Prometheus servers by the federation server:
Now we have all the relevant variables, and we wish to use the dashboard panels. The Mixed option is the built-in grafana solution for this case. The big problem here is that this solution is query-based, so when you change/create a new query, you should do it multiple times – for each of your data sources (In our case – the regions/zones):
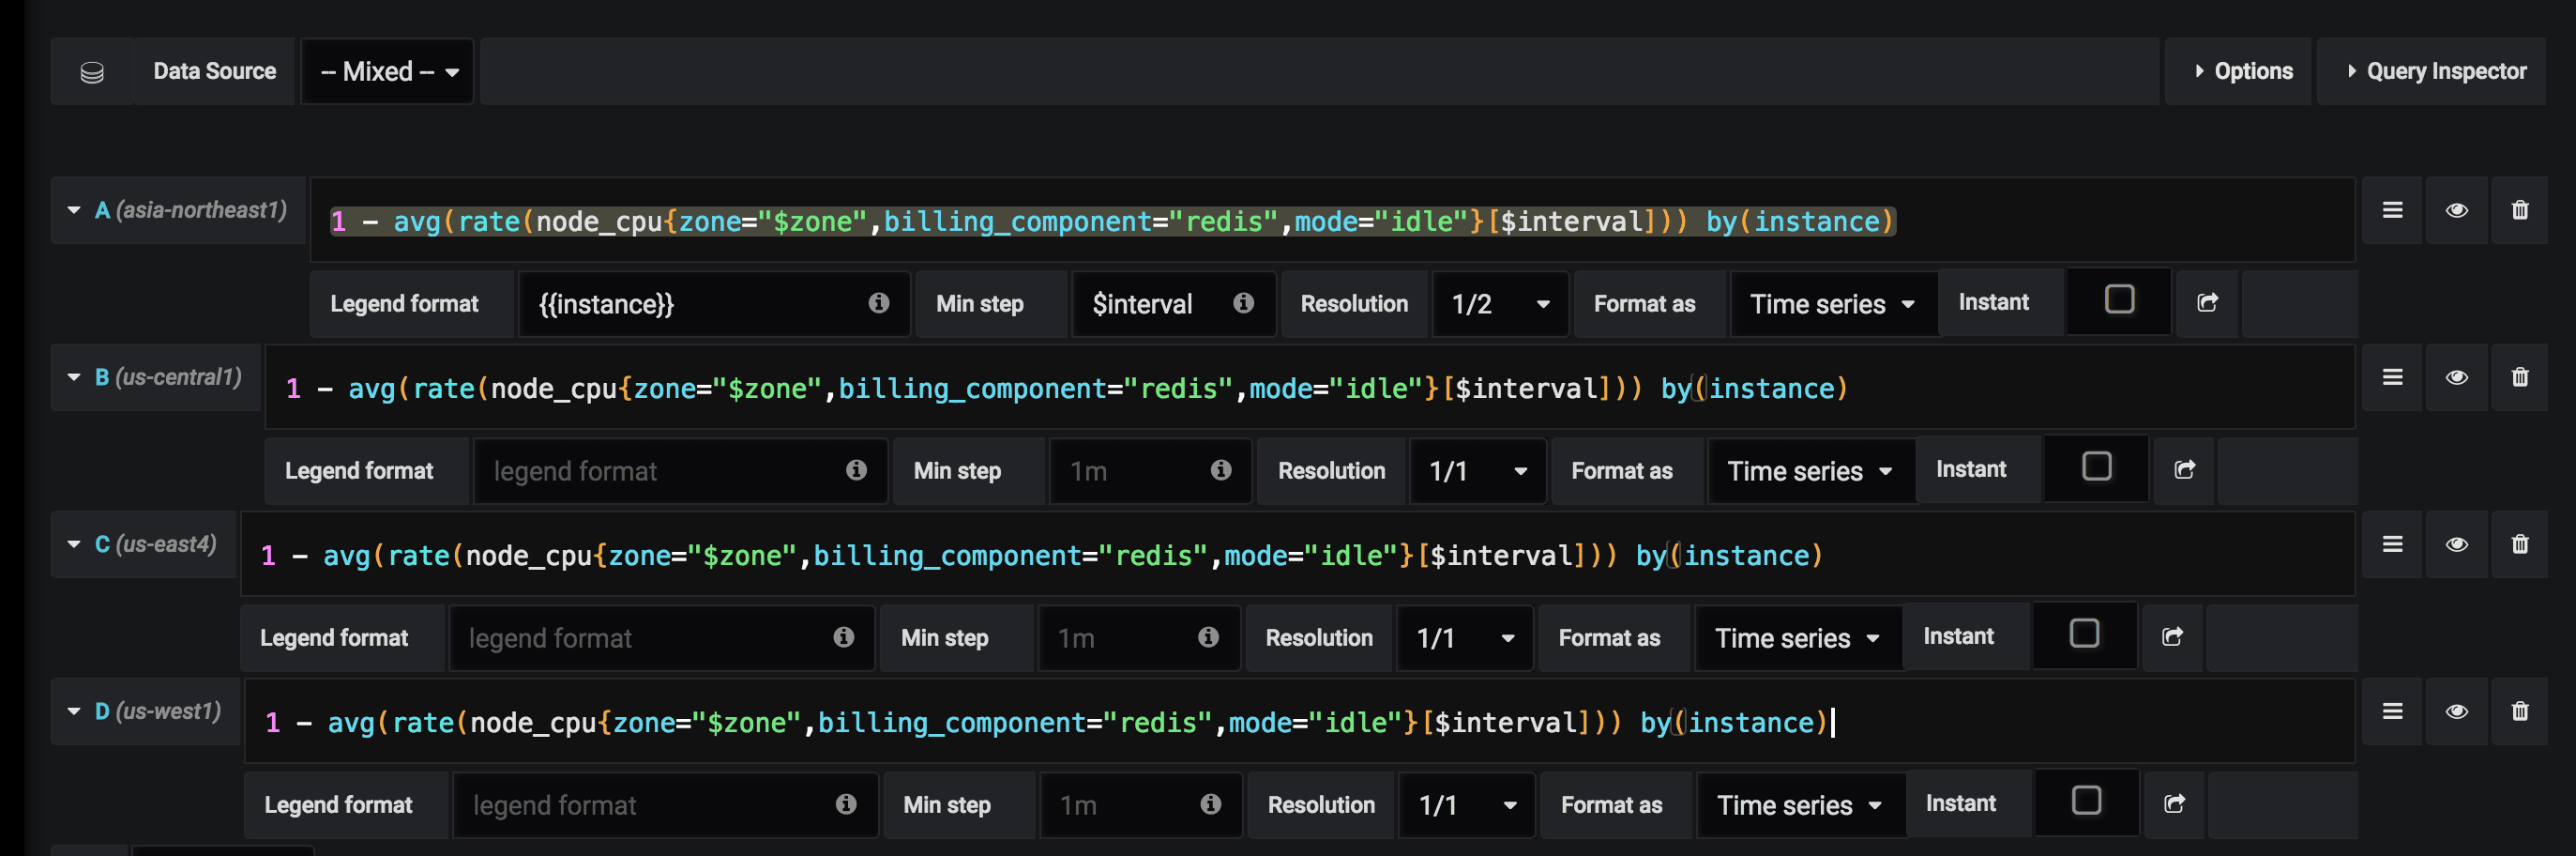
We dreaded to imagine having to modifying 20 heavy dashboards to this format, so we started to implement a parser to convert all queries with the default datasource to use the Mixed option. While better, it still didn’t seem reasonable to us that we will need to run it every time we create a new query (or copy-paste our query to the number of datasources we had).
The solution lies in the variable tab. Because we already have all regions in a template variable, we can create multiple data sources by mapping the region/zone names to the datasource URL’s:
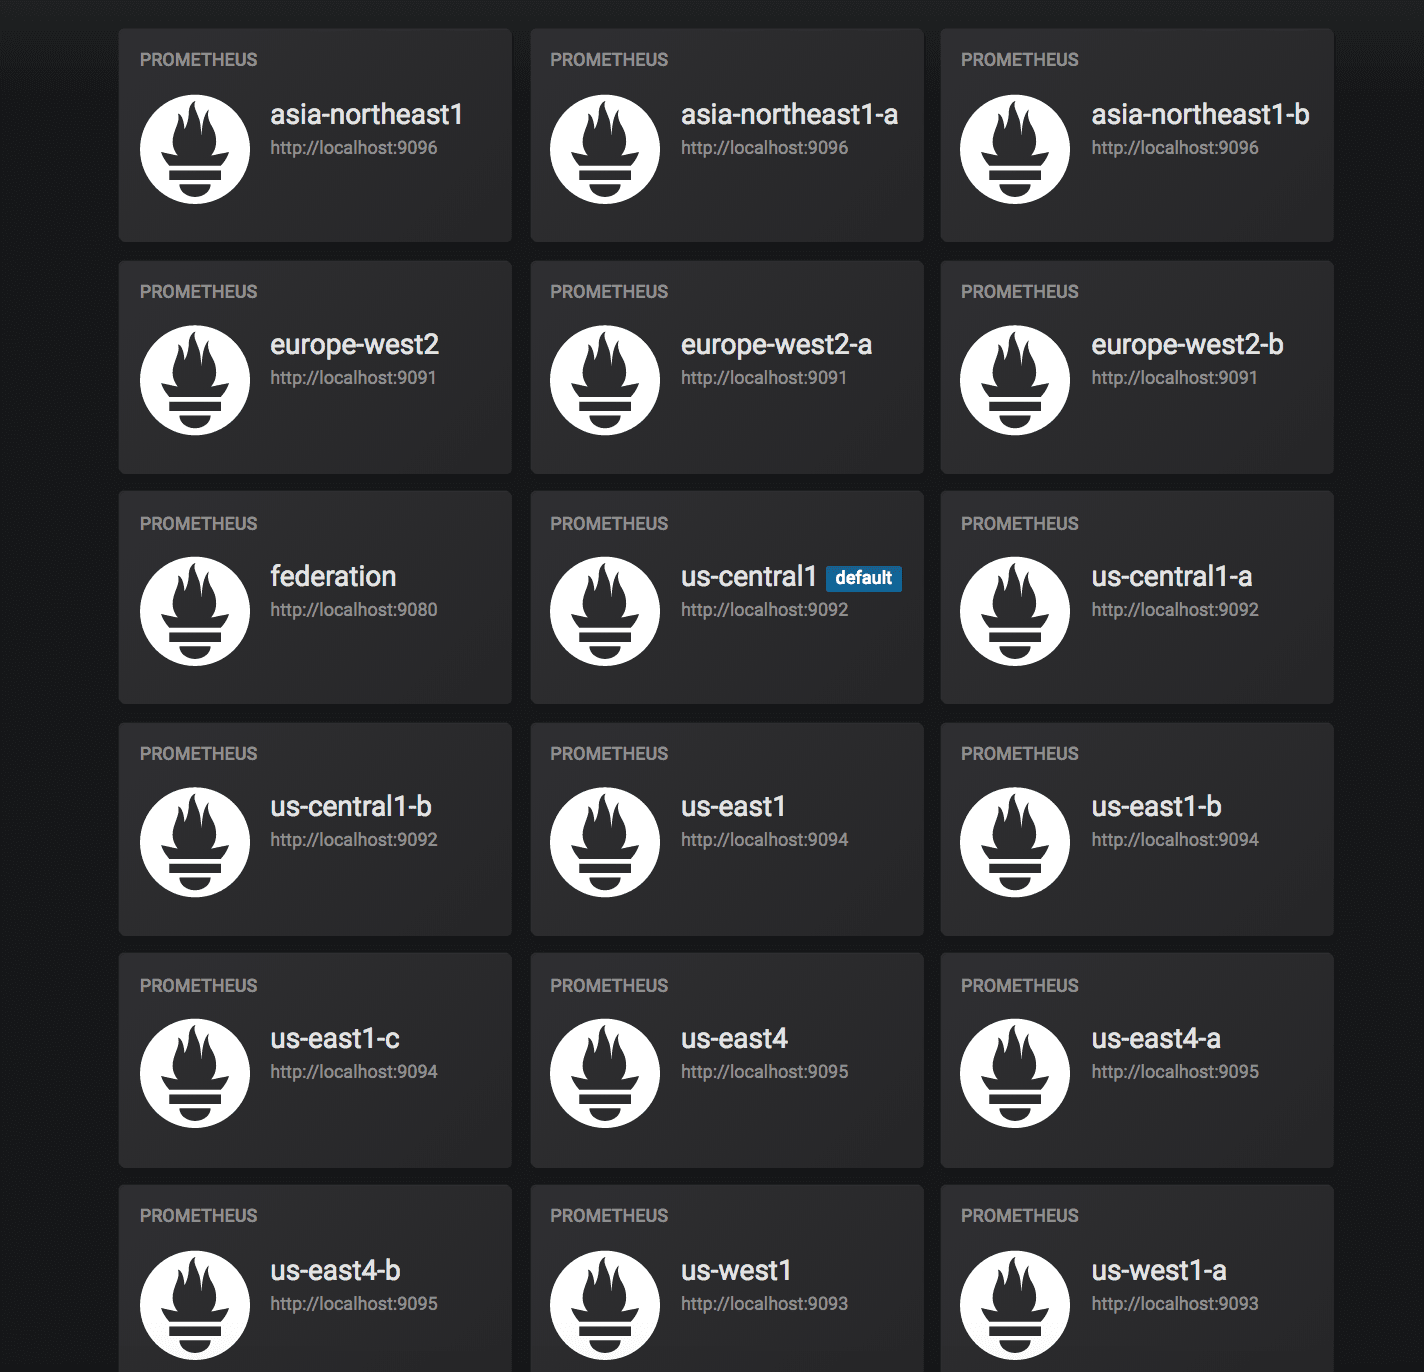
And in the dashboard variable, we can define the following using the instance name filter option:
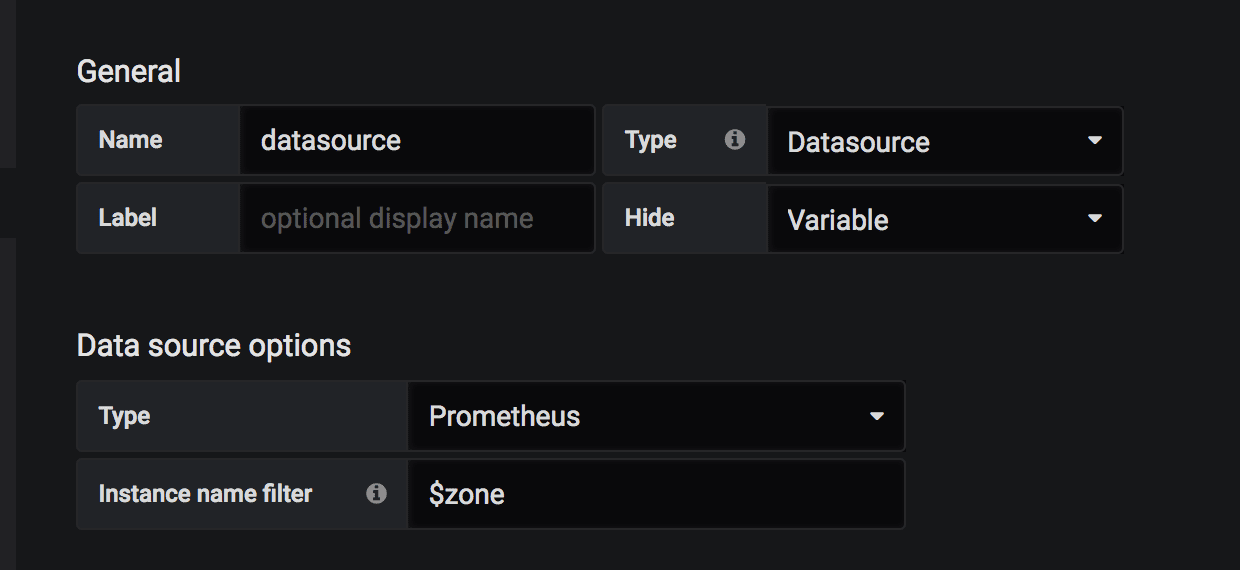
So now, every time we choose the zone/region in the dashboard, we actually also choose in the background the relevant Prometheus server:
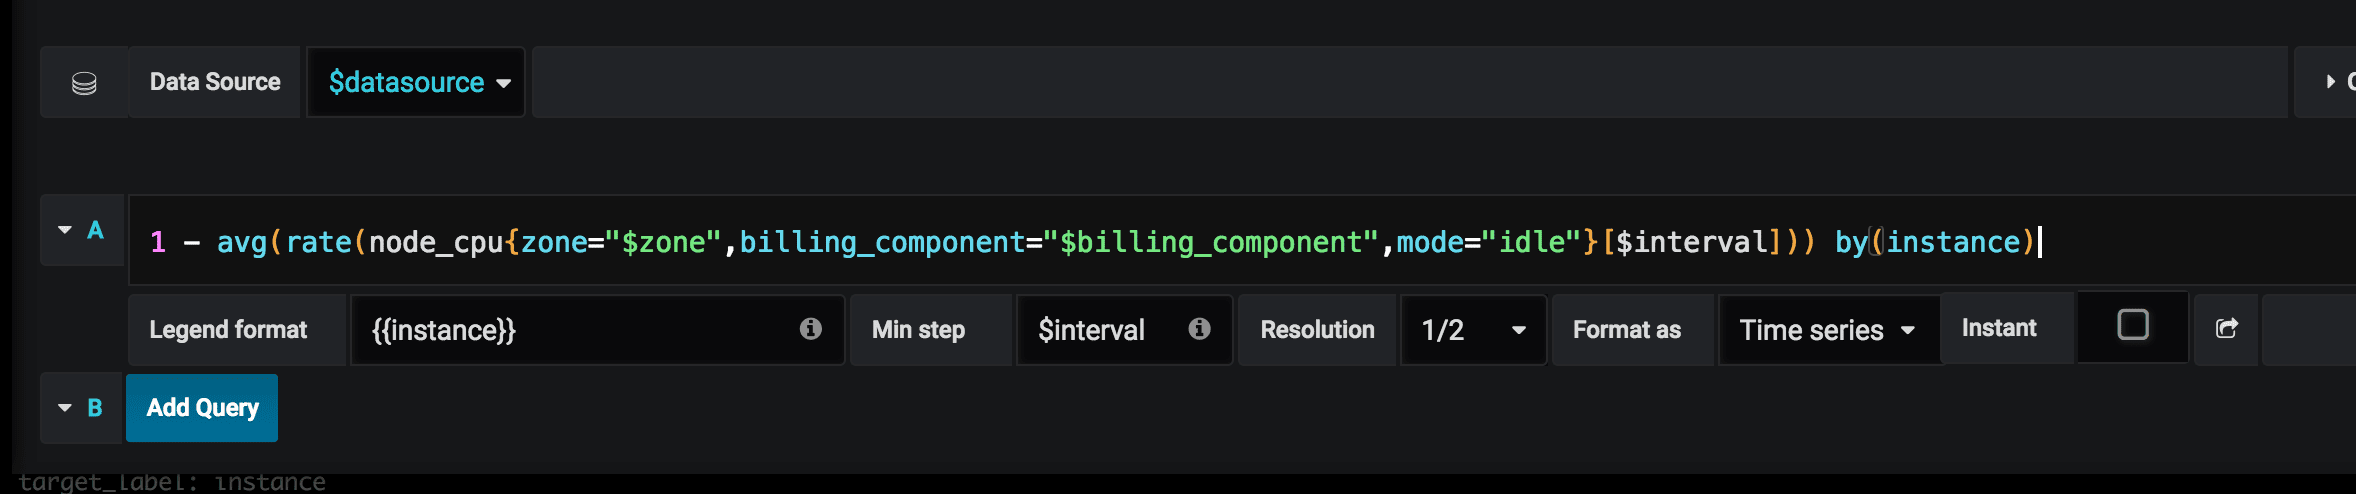
In our case its region, but you can create a Prometheus server for any service or other relevant label, and query it this way.
Epilogue
In the original setup we had a relatively large and centralized Prometheus server. After realizing this solution will not scale easily with the rest of our platform, we decentralized the Prometheus servers with a POP based solution, which made sense since our POPs run as a regional autonomous unit.
The fact we don’t have many aggregated alerts between POPs was beneficial in adopting this architecture, without losing the ability to create some aggregated alerts where needed with the federation method.