
At HUMAN Security, we process trillions of events every day as part of how we defend the internet from bot attacks and fraud. Behind the scenes, we have created a data platform that is able to handle this massive volume of incoming data. One system we rely on heavily for routing messages is Apache Kafka. Across our various Kafka clusters we receive hundreds of thousands of messages every second which need to be accessed in a timely fashion to prevent latency in a fraud-or-not response. This means that throughput and the performance aspects of Kafka are crucial in order to be able to process data as quickly as possible.
There are numerous options for performance-tuning Kafka, but this post will focus specifically on optimising the throughput of a Kafka producer by changing the compression.type in use.
Disabling gzip compression
One of our internal systems receives messages from an HTTP REST endpoint, processes each message and produces a transformed message onto a Kafka topic. We noticed a significant throughput degradation when upgrading the Java “kafka-clients” library from version 2.2.0 to 2.7.0, but the root cause of this slowdown was not immediately clear.
In a separate workstream, we had a Kafka producer running with 2.7.0 that generated load for a stress test and noted that it was achieving significantly higher throughput on similar hardware and the same type and size of messages. When we compared the two systems for differences, we noticed that the load generator wasn’t compressing messages while the production producer was using “gzip” compression. So we upgraded the version of “kafka-clients” in the production system to 2.7.0, disabled gzip compression, ran a load test and observed that the throughput degradation went away.
Job done? Sadly not as there are downsides to removing compression (e.g. increased network bandwidth) which can become a concern at our scale, so completely removing compression wasn’t really an option.
Testing other compression options
We started off by looking at other Kafka compression benchmarks starting with the “OG” of compression comparisons between Snappy and gzip which concluded that “Producer throughput is 228% higher with Snappy as compared to gzip”. That data point is 10 years old and from a much older version of Kafka than we have in use, so is it still reliable? And what about the other compression options that have been added to Kafka since then? This post on getting the most from Kafka compression rated Snappy and zstd as good options but was also done with an old version of Kafka (1.0.0). Intel produced a Kafka Optimization and Benchmarking Guide which covers different aspects of Kafka, and section 4 specifically shows gzip attaining generally lower throughput than the other available compression algorithms.
Benchmarks done by others may not always be applicable to one’s own use cases, and we already had a performance test setup where it would be relatively quick and easy to replicate a “production like” workload. So we decided to try out the various compression options (gzip, LZ4, Snappy and zstd) with our Kafka producer and see which provided the highest throughput. The diagram below provides an overview of what our benchmark setup looks like:

We use Apache JMeter to send JSON messages – which represent a typical production workload – to our service, which is a Spring Boot application providing an HTTP REST endpoint for the messages. Internally, this puts the messages onto a worker queue, which in test mode is configured to skip all transformations and instead makes the messages immediately available to the Kafka Producer.
The Kafka Producer can be configured to use different compression algorithms and then sends messages to a Kafka cluster. JMeter provides various metrics which allow us to observe the maximum throughput achieved and we also have system metrics on memory usage, CPU, network bandwidth etc.
For each compression method we ran the test while modifying the throughput sent from JMeter. We did this multiple times until we found a value that the system was able to handle for 15 minutes without filling the worker queue or blocking in any way and noted this as “maximum throughput”.
A more detailed methodology is included at the end of this post for those interested in the specifics.
Test results
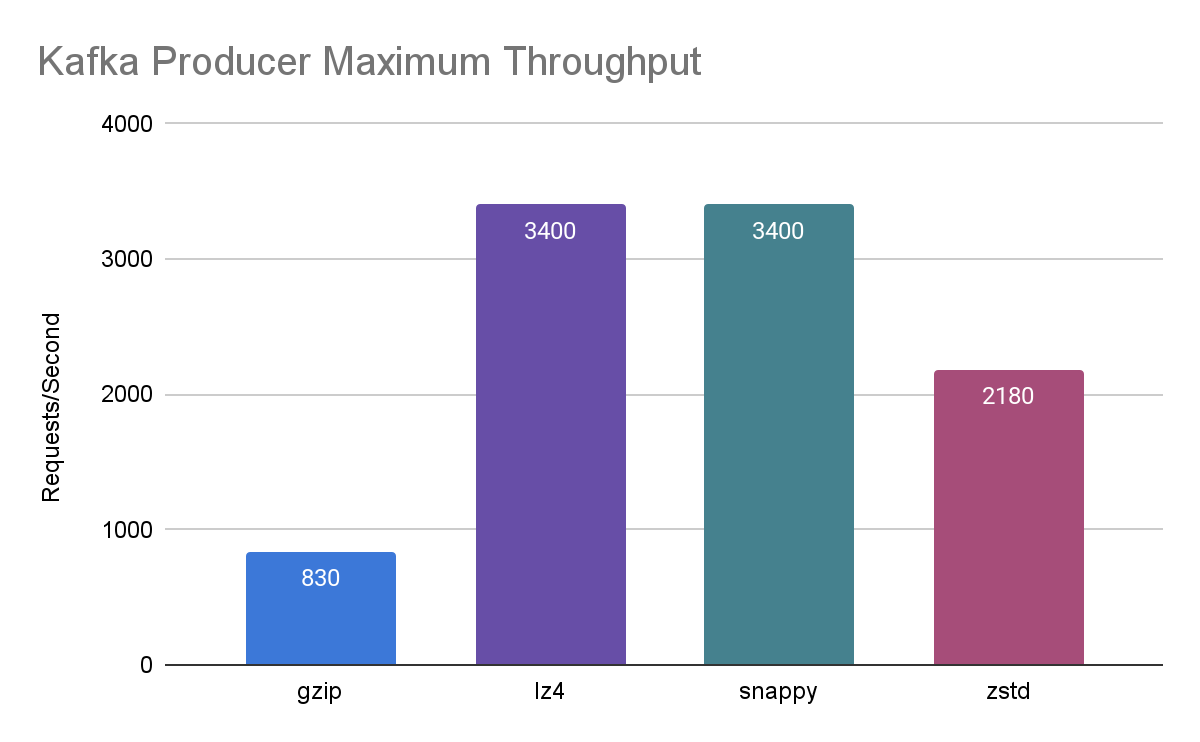
The graph below summarises the results and shows that Snappy and LZ4 compression were able to achieve significantly higher throughput (approximately 3400 messages per second) compared to zstd (2180) and gzip (830).
An interesting point that we noticed while looking at various metrics for each run was that the bottleneck for gzip and zstd did not appear to be CPU, as the CPU usage for both of these was significantly lower that for LZ4 and Snappy:
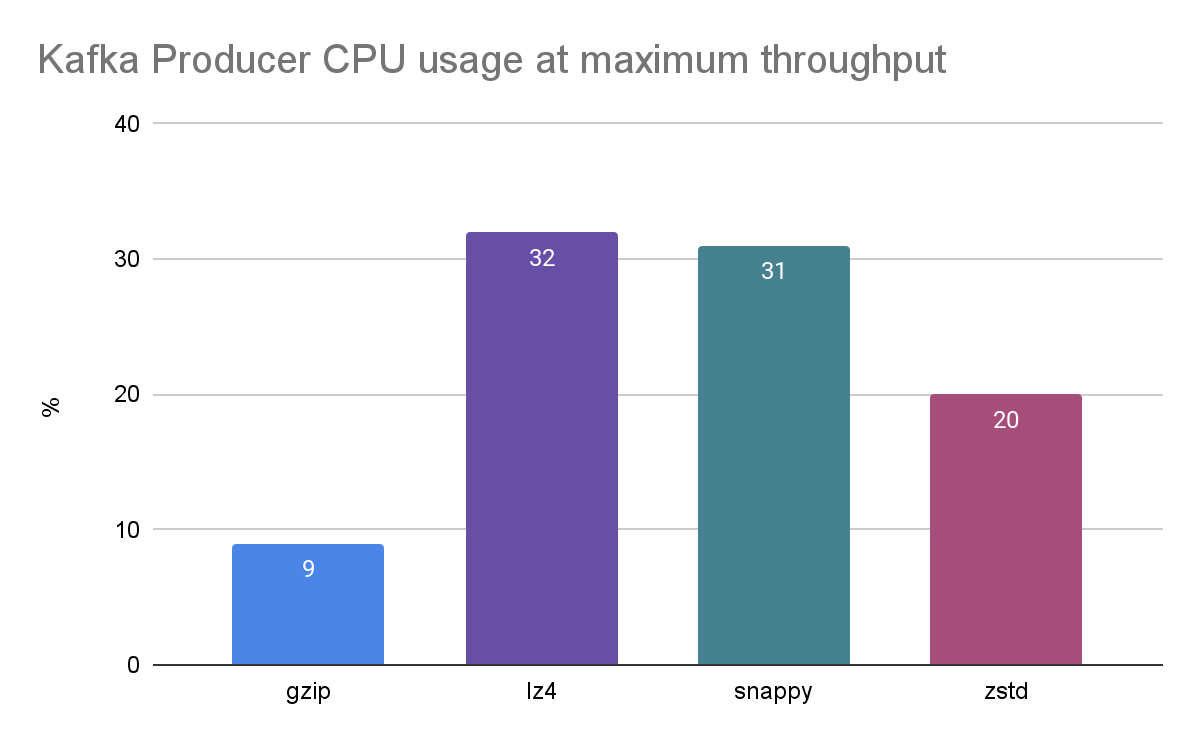
This counterintuitive finding indicates that there is some other form of contention that is reducing their maximum throughput. We noticed something similar when benchmarking another one of our systems which compresses (non-Kafka) data with the same algorithms. It exhibited very similar behaviour with Snappy outperforming gzip for throughput. We performed some profiling on that application, and it appeared to be due to how locking is implemented somewhere either in the Java or native code for the compression libraries in use.
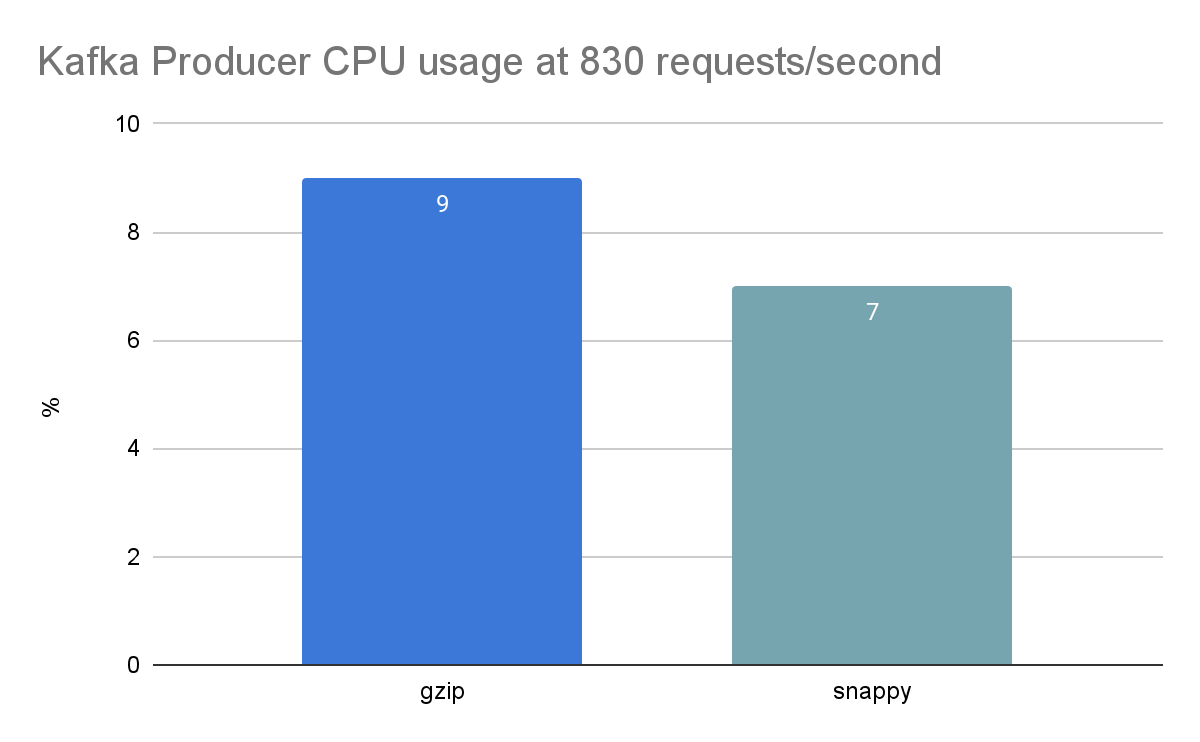
As a final comparison, we decided to look at the CPU usage of just gzip (in use by our production system at that point) and Snappy (our new contender) for the same level of requests/second that gzip could handle as a maximum (830). The results are shown in the chart below and indicate that, for a similar level of throughput, Snappy uses marginally less CPU.
For our use case, getting the maximum amount of compression out of the various algorithms wasn’t the main goal so we didn’t aim to optimise for this. We monitored network bandwidth as a “proxy” for compressed data size and noticed that all the algorithms produced lower bandwidth than no compression (it would have been very strange if this wasn’t the case!) and that Snappy produced more bandwidth than gzip at the same throughput. These data points line up with the many existing benchmarks that show that gzip produces a higher compression ratio than Snappy.
Conclusions
We decided to move forward with upgrading our “kafka-clients” library and switching from gzip to Snappy compression at the same time in our production cluster. This was successful and has been running in a stable fashion for many weeks now. Our metrics for the production systems showed the following “real world” metrics that may be of interest to others:
- No difference in CPU usage – the other work our service does in processing requests dwarfs the amount of CPU used for compressing outbound messages.
- Approximately a 3x reduction of the time taken to send messages out to Kafka – i.e. Snappy is quicker than gzip.
- Approximately double the outbound network bandwidth (i.e. Snappy compresses less than gzip)
We hope the above information is useful and provides you with some data points that may be of interest to how you maximise your own Kafka producers. As always, your mileage may vary and we encourage you to perform benchmarks for your use cases as these may produce very different results.
Detailed Methodology
For those interested in the specifics of how we ran the test here is the relevant information.
Load Generator
Apache JMeter 5.6.2 was run on an AWS EC2 “c5n.4xlarge” node with Java 1.8.0_141 and no special arguments other than export HEAP=”-Xms8g -Xmx8g”. The JMeter test plan used a “thread group” with 48 threads and a ramp-up period of 180 seconds. The inputs sent to Kafka via the HTTP REST endpoint were several thousand JSON documents chosen in “round robin” fashion with file sizes ranging from 5KB to 400KB. A “constant throughput timer” was configured with a targeted number of requests per minute that maximised the throughput for the compression algorithm being tested.
Kafka Producer
The Kafka Producer was run via a Spring Boot application running on an AWS EC2 “c5n.4xlarge” node with OpenJDK 11.0.19 and no special arguments other than “ -Xms32g -Xmx32g”. The version of “spring-kafka” was 2.8.11 which in turn uses “kafka-clients” version 3.1.2. The only configuration options passed to the Kafka producer were “acks=1”, “key-serializer=org.apache.kafka.common.serialization.LongSerializer”, “value-serializer=org.apache.kafka.common.serialization.StringSerializer” and obviously “compression-type” set to one of “gzip”, “snappy”, “lz4” or “zstd”. All communications with the Kafka brokers were in plain text with no authentication or encryption.
Kafka Cluster
The Kafka cluster consisted of 5 nodes running on AWS EC2 “c5n.4xlarge” instances with OpenJDK 17.0.6. The Kafka version was 3.4.0 in “KRaft” mode with 3 nodes as brokers and KRaft controllers and 2 nodes were brokers only. The Kafka nodes all used their default configuration (with the exception of “log.retention.hours” set to “24”) and the only command line argument passed on startup was export KAFKA_HEAP_OPTS=”-Xmx4G -Xms4G”. There was a single topic in use and it had 300 partitions and a replication factor of 3.