
As web applications become more and more advanced, placing business application logic on CDN edge servers becomes a necessity.
Great CDN solution providers, like Fastly, offer platforms to write your own logic on their edge servers so that if you need some logic executed efficiently with low latency, or without causing extra load on our backends, we can place it there.
At HUMAN, we detect bots (non-human clients) and block them from accessing site resources and hurting their business, based on deep analysis of the user’s behavior. To minimize the overhead over the requests we monitor and the impact of bots over our customers’ infrastructure, we need to apply our detection as early as possible in the request flow – And what place is more appropriate than on the CDN edge?
Let’s talk a bit about the Fastly Platform.
At the core of Fastly is Varnish, an open source web accelerator that’s designed for high-performance content delivery. Varnish is the key to being able to accelerate dynamic content, APIs, and logic at the edge”. – Benefits of Using Varnish)
Varnish has a domain specific language called VCL (Varnish Configuration Language) that lets you influence how each request is being handled.
Here at HUMAN, we value code quality. After writing our application logic in VCL, we needed to test it. Since Fastly extended Varnish greatly and integrated it deep into their platform, we cannot simply run our logic inside a local varnish instance and run our tests there.
So, the natural thing to do was writing a full-featured End-to-End testing suite. After writing some tests, we ran into a problem – How can we know that our tests really cover all of the important flows and logic?
TL;DR:
In this post we will:
- Understand what instrumentation is and why it’s useful.
- See how we can apply it for code that is being executed in special environments.
- Implement an instrumentation mechanism end-to-end for producing code coverage reports for VCL running on the Fastly CDN platform.
If you prefer to dive straight into the source code, we open sourced it, so enjoy: https://github.com/PerimeterX/remote-code-cover
Before Proceeding
I assume you have basic familiarity with the Fastly Platform, VCL and Python. But even if you don’t, you will still learn the conpect – which is the most important.
Enter Instrumentation
“Instrumentation refers to an ability to monitor or measure the level of a product’s performance, to diagnose errors, and to write trace information.” – Wikipedia.
What instrumentation practically aims to achieve is tracking the execution of the code during runtime.
There are generally two types of instrumentation techniques:
Offline instrumentation
Offline instrumentation is a technique to modify the source code or the byte code at compile time in order to track the execution of the code at runtime. In practice, this means that the code coverage tool injects data collector calls into your source or byte code to record if a line was executed or not.
On-the-fly instrumentation
This instrumentation process happens on-the-fly during class loading by using a special agent or a special ClassLoader so the source/byte code remains untouched.
Reference: https://medium.com/@jonatan_ivanov/code-coverage-not-only-for-unit-tests-419f3c73d00
As you probably guessed, instrumentation is what allows us to analyze test coverage, and this is what we needed for our End-to-end tests to understand their real effectiveness.
Implementing your own instrumentation tool
Let’s get to business. We will now walk through the creation of an offline instrumentation library for VCL that allowed us to get the following results for our tests:

How it usually works
Most of the offline instrumentation tools out there initialize some global in-memory data structure and inject logic to the source code to update that data structure in every line of code when it’s executed.
How we did it
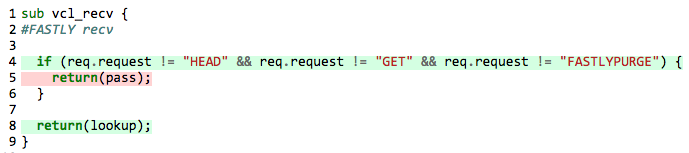
Since Varnish does not keep state between requests, and the only way to transfer data between subroutines is using headers which is costly in memory (Varnish workspace), we decided to utilize local variables and logging (via Syslog) to send instrumentation tracing data during runtime. Let’s see an example:
Original Code:
sub vcl_recv <span class="token punctuation">{</span>
<span class="token comment">#FASTLY recv</span>

	<span class="token keyword">if</span> <span class="token punctuation">(</span>req<span class="token punctuation">.</span>method <span class="token operator">!=</span> <span class="token string">"HEAD"</span> <span class="token operator">&&</span> req<span class="token punctuation">.</span>method <span class="token operator">!=</span> <span class="token string">"GET"</span> <span class="token operator">&&</span> req<span class="token punctuation">.</span>method <span class="token operator">!=</span> <span class="token string">"FASTLYPURGE"</span><span class="token punctuation">)</span> <span class="token punctuation">{</span>
		<span class="token keyword">return</span><span class="token punctuation">(</span>pass<span class="token punctuation">)</span><span class="token punctuation">;</span>
	<span class="token punctuation">}</span>

	<span class="token keyword">return</span><span class="token punctuation">(</span>lookup<span class="token punctuation">)</span><span class="token punctuation">;</span>
<span class="token punctuation">}</span>
Instrumented Code:
sub vcl_recv <span class="token punctuation">{</span>
	declare local var<span class="token punctuation">.</span>log_8 <span class="token constant">BOOL</span><span class="token punctuation">;</span>
   	declare local var<span class="token punctuation">.</span>log_5 <span class="token constant">BOOL</span><span class="token punctuation">;</span>
   	declare local var<span class="token punctuation">.</span>log_4 <span class="token constant">BOOL</span><span class="token punctuation">;</span>
<span class="token comment">#FASTLY recv</span>
   	set var<span class="token punctuation">.</span>log_4 <span class="token operator">=</span> <span class="token boolean">true</span><span class="token punctuation">;</span>
  	<span class="token keyword">if</span> <span class="token punctuation">(</span>req<span class="token punctuation">.</span>request <span class="token operator">!=</span> <span class="token string">"HEAD"</span> <span class="token operator">&&</span> req<span class="token punctuation">.</span>request <span class="token operator">!=</span> <span class="token string">"GET"</span> <span class="token operator">&&</span> req<span class="token punctuation">.</span>request <span class="token operator">!=</span> <span class="token string">"FASTLYPURGE"</span><span class="token punctuation">)</span> <span class="token punctuation">{</span>
    	set var<span class="token punctuation">.</span>log_5 <span class="token operator">=</span> <span class="token boolean">true</span><span class="token punctuation">;</span>
    	log <span class="token string">"syslog "</span> req<span class="token punctuation">.</span>service_id <span class="token string">" Px-Instrumentation :: main,"</span> <span class="token operator">+</span> <span class="token keyword">if</span><span class="token punctuation">(</span>var<span class="token punctuation">.</span>log_4<span class="token punctuation">,</span> <span class="token string">"4 "</span><span class="token punctuation">,</span> <span class="token string">""</span><span class="token punctuation">)</span> <span class="token operator">+</span> <span class="token keyword">if</span><span class="token punctuation">(</span>var<span class="token punctuation">.</span>log_5<span class="token punctuation">,</span> <span class="token string">"5 "</span><span class="token punctuation">,</span> <span class="token string">""</span><span class="token punctuation">)</span><span class="token punctuation">;</span>
    	<span class="token keyword">return</span><span class="token punctuation">(</span>pass<span class="token punctuation">)</span><span class="token punctuation">;</span>
  	<span class="token punctuation">}</span>
  	set var<span class="token punctuation">.</span>log_8 <span class="token operator">=</span> <span class="token boolean">true</span><span class="token punctuation">;</span>
  	log <span class="token string">"syslog "</span> req<span class="token punctuation">.</span>service_id <span class="token string">" Px-Instrumentation :: main,"</span> <span class="token operator">+</span> <span class="token keyword">if</span><span class="token punctuation">(</span>var<span class="token punctuation">.</span>log_4<span class="token punctuation">,</span> <span class="token string">"4 "</span><span class="token punctuation">,</span> <span class="token string">""</span><span class="token punctuation">)</span> <span class="token operator">+</span> <span class="token keyword">if</span><span class="token punctuation">(</span>var<span class="token punctuation">.</span>log_5<span class="token punctuation">,</span> <span class="token string">"5 "</span><span class="token punctuation">,</span> <span class="token string">""</span><span class="token punctuation">)</span> <span class="token operator">+</span> <span class="token keyword">if</span><span class="token punctuation">(</span>var<span class="token punctuation">.</span>log_8<span class="token punctuation">,</span> <span class="token string">"8 "</span><span class="token punctuation">,</span> <span class="token string">""</span><span class="token punctuation">)</span><span class="token punctuation">;</span>
  	<span class="token keyword">return</span><span class="token punctuation">(</span>lookup<span class="token punctuation">)</span><span class="token punctuation">;</span>
  	log <span class="token string">"syslog "</span> req<span class="token punctuation">.</span>service_id <span class="token string">" Px-Instrumentation :: main,"</span> <span class="token operator">+</span> <span class="token keyword">if</span><span class="token punctuation">(</span>var<span class="token punctuation">.</span>log_4<span class="token punctuation">,</span> <span class="token string">"4 "</span><span class="token punctuation">,</span> <span class="token string">""</span><span class="token punctuation">)</span> <span class="token operator">+</span> <span class="token keyword">if</span><span class="token punctuation">(</span>var<span class="token punctuation">.</span>log_5<span class="token punctuation">,</span> <span class="token string">"5 "</span><span class="token punctuation">,</span> <span class="token string">""</span><span class="token punctuation">)</span> <span class="token operator">+</span> <span class="token keyword">if</span><span class="token punctuation">(</span>var<span class="token punctuation">.</span>log_8<span class="token punctuation">,</span> <span class="token string">"8 "</span><span class="token punctuation">,</span> <span class="token string">""</span><span class="token punctuation">)</span><span class="token punctuation">;</span>
<span class="token punctuation">}</span>
So, what happened here?
- We declared BOOL local variables at the beginning of the subroutine for each tested line.
- Before line number N, we set
var.log_Ntotrueto indicate that this line was executed. - Before any return from the subroutine, we sent a log message with our VCL file name (“main”) and space-separated line numbers that were executed.
- We ignored comments and other lines of code that are not interesting for code execution coverage.
If we call our endpoint with a GET request, we see the following log lines in our syslog endpoint:
...
Feb 28 13:46:05 cache-fra19141 Px-Instrumentation[380410]: main,4 8
...
And indeed, after parsing these logs nicely in HTML we ended up with:
From here, we can easily extend our analysis and use-cases further:
- Calculate test coverage percentage (I doubt that setting some percentage threshold as a KPI for success is a good idea on its own, for more information on this, I advise reading Test Coverage – Martin Fowler).
- Count how many times the lines of code were executed to track down performance issues.
Important note: it’s probably not a good idea to upload instrumented code to a production environment. Under heavy load, all of these Syslogs will probably not behave well.
End to End Implementation
To integrate this method well with our End-to-End testing framework, we needed to automate the whole instrumentation and report generation process.
To accomplish this, we built a python CLI application with a simple “cover” command that does everything for us. The main flow of the application:
- Use Fastly REST API to fetch the existing VCL code from the Fastly Service that is provided as a CLI argument.
- Inject instrumentation logic into the existing code.
- Upload the new code including a syslog log sink definition (the target for the logs) to the service as a new version and activate it.
- Spin up a Ngrok and Syslog Server docker containers. The Ngrok container exposes a TCP URL that is forwarded to the Syslog server container to ingest instrumentation logs.
- (Run our usual End-to-End tests pointing to the service endpoint)
- Parse and process the logs into a coverage object that contains instrumentation metadata.
- Produce a nice looking HTML report based on the coverage object.
Let’s see how it’s done, step-by-step (for the sake of brevity some of the helper methods are removed):
1. Fetch existing VCL code from the service
This is easily done via Fastly’s REST API:
<span class="token keyword">def</span> <span class="token function">get_all_custom_vcls</span><span class="token punctuation">(</span>service_id<span class="token punctuation">,</span> version<span class="token punctuation">)</span><span class="token punctuation">:</span>
    url <span class="token operator">=</span> <span class="token string">'https://api.fastly.com/service/{}/version/{}/vcl'</span><span class="token punctuation">.</span><span class="token builtin">format</span><span class="token punctuation">(</span>service_id<span class="token punctuation">,</span> version<span class="token punctuation">)</span>
    response <span class="token operator">=</span> requests<span class="token punctuation">.</span>request<span class="token punctuation">(</span><span class="token string">'GET'</span><span class="token punctuation">,</span> url<span class="token punctuation">,</span> headers<span class="token operator">=</span><span class="token punctuation">{</span><span class="token punctuation">.</span><span class="token punctuation">.</span><span class="token punctuation">.</span><span class="token punctuation">}</span><span class="token punctuation">)</span>
    <span class="token keyword">return</span> response<span class="token punctuation">.</span>json<span class="token punctuation">(</span><span class="token punctuation">)</span>
Calling this method returns our VCLs as a list of dictionaries:
<span class="token punctuation">[</span>
  <span class="token punctuation">{</span>
    <span class="token property">"content"</span><span class="token operator">:</span> <span class="token string">"<vcl code>"</span><span class="token punctuation">,</span>
    <span class="token property">"main"</span><span class="token operator">:</span> <is_main_vcl><span class="token punctuation">,</span>
    <span class="token property">"name"</span><span class="token operator">:</span> <span class="token string">"<vcl_name>"</span><span class="token punctuation">,</span>
    <span class="token property">"service_id"</span><span class="token operator">:</span> <span class="token string">"<service_id>"</span><span class="token punctuation">,</span>
    <span class="token property">"version"</span><span class="token operator">:</span> <version>
  <span class="token punctuation">}</span><span class="token punctuation">,</span>
  ...
<span class="token punctuation">]</span>
2. Inject the instrumentation logic
Injecting the instrumentation source code is a tricky task. The best way to achieve that is by defining a grammar for the VCL language and then use it to parse the code as an AST (Abstract Syntax Tree) and then inject the code before the appropriate nodes.
We took a simpler approach of iterating over the code lines and identifying entry points where we want to inject our instrumentation code (subroutine definitions omitted for brevity):
<span class="token keyword">def</span> <span class="token function">add_instrumentation</span><span class="token punctuation">(</span>name<span class="token punctuation">,</span> content<span class="token punctuation">)</span><span class="token punctuation">:</span>
    lines <span class="token operator">=</span> content<span class="token punctuation">.</span>split<span class="token punctuation">(</span><span class="token string">'n'</span><span class="token punctuation">)</span>
    original_line_count <span class="token operator">=</span> <span class="token number">1</span>
    instrumented_lines <span class="token operator">=</span> <span class="token punctuation">[</span><span class="token punctuation">]</span>
    subroutine_parenthesis_stack <span class="token operator">=</span> <span class="token punctuation">[</span><span class="token punctuation">]</span>
    sub_tested_line_numbers <span class="token operator">=</span> <span class="token punctuation">[</span><span class="token punctuation">]</span>
    tested_line_numbers <span class="token operator">=</span> <span class="token punctuation">[</span><span class="token punctuation">]</span>
    cur_subroutine_decl_line_number <span class="token operator">=</span> <span class="token number">0</span>
    in_subroutine <span class="token operator">=</span> <span class="token boolean">False</span>
    in_synthetic <span class="token operator">=</span> <span class="token boolean">False</span>

    <span class="token keyword">for</span> raw_line <span class="token keyword">in</span> lines<span class="token punctuation">:</span>
        stripped_line <span class="token operator">=</span> strip_line<span class="token punctuation">(</span>raw_line<span class="token punctuation">)</span>
        is_tested <span class="token operator">=</span> do_test_line<span class="token punctuation">(</span>stripped_line<span class="token punctuation">)</span>
        l_ws_cou <span class="token operator">=</span> count_leading_whitespaces<span class="token punctuation">(</span>raw_line<span class="token punctuation">)</span>

        <span class="token keyword">def</span> <span class="token function">add_log_line</span><span class="token punctuation">(</span>subroutine_decl_line_number<span class="token operator">=</span>cur_subroutine_decl_line_number<span class="token punctuation">,</span> my_l_ws_cou<span class="token operator">=</span>l_ws_cou<span class="token punctuation">)</span><span class="token punctuation">:</span>
            instrumented_lines<span class="token punctuation">.</span>append<span class="token punctuation">(</span>get_var_line<span class="token punctuation">(</span>original_line_count<span class="token punctuation">,</span> tested_line_numbers<span class="token punctuation">,</span> sub_tested_line_numbers<span class="token punctuation">,</span>
                                                   instrumented_lines<span class="token punctuation">,</span> subroutine_decl_line_number<span class="token punctuation">,</span> my_l_ws_cou<span class="token punctuation">)</span><span class="token punctuation">)</span>

        <span class="token keyword">if</span> is_line_sub_header<span class="token punctuation">(</span>stripped_line<span class="token punctuation">)</span><span class="token punctuation">:</span>
            <span class="token comment"># if we reached a sub header, we add the log for it *after*</span>
            <span class="token comment"># the line since we can't log outside subroutines</span>
            in_subroutine <span class="token operator">=</span> <span class="token boolean">True</span>
            instrumented_lines<span class="token punctuation">.</span>append<span class="token punctuation">(</span>raw_line<span class="token punctuation">)</span>
            cur_subroutine_decl_line_number <span class="token operator">=</span> <span class="token builtin">len</span><span class="token punctuation">(</span>instrumented_lines<span class="token punctuation">)</span>
            subroutine_parenthesis_stack<span class="token punctuation">.</span>append<span class="token punctuation">(</span>original_line_count<span class="token punctuation">)</span>
        <span class="token keyword">elif</span> <span class="token keyword">not</span> in_subroutine<span class="token punctuation">:</span>
            instrumented_lines<span class="token punctuation">.</span>append<span class="token punctuation">(</span>raw_line<span class="token punctuation">)</span>
        <span class="token keyword">elif</span> in_subroutine<span class="token punctuation">:</span>
            <span class="token keyword">if</span> stripped_line<span class="token punctuation">[</span><span class="token punctuation">:</span><span class="token number">11</span><span class="token punctuation">]</span> <span class="token operator">==</span> <span class="token string">'synthetic {'</span><span class="token punctuation">:</span>
                add_log_line<span class="token punctuation">(</span>subroutine_decl_line_number<span class="token operator">=</span>cur_subroutine_decl_line_number<span class="token punctuation">,</span>
                             my_l_ws_cou<span class="token operator">=</span><span class="token number">2</span><span class="token punctuation">)</span>
                in_synthetic <span class="token operator">=</span> <span class="token boolean">True</span>
                <span class="token keyword">if</span> stripped_line<span class="token punctuation">[</span><span class="token operator">-</span><span class="token number">2</span><span class="token punctuation">:</span><span class="token punctuation">]</span> <span class="token operator">==</span> <span class="token string">'};'</span><span class="token punctuation">:</span>
                    in_synthetic <span class="token operator">=</span> <span class="token boolean">False</span>
            <span class="token keyword">elif</span> in_synthetic<span class="token punctuation">:</span>
                <span class="token keyword">if</span> stripped_line<span class="token punctuation">[</span><span class="token operator">-</span><span class="token number">2</span><span class="token punctuation">:</span><span class="token punctuation">]</span> <span class="token operator">==</span> <span class="token string">'};'</span><span class="token punctuation">:</span>
                    in_synthetic <span class="token operator">=</span> <span class="token boolean">False</span>
            <span class="token keyword">elif</span> has_close_params<span class="token punctuation">(</span>is_tested<span class="token punctuation">,</span> stripped_line<span class="token punctuation">)</span><span class="token punctuation">:</span>  <span class="token comment"># is_close_parens</span>
                subroutine_parenthesis_stack<span class="token punctuation">.</span>pop<span class="token punctuation">(</span><span class="token punctuation">)</span>
                <span class="token keyword">if</span> end_of_subroutine<span class="token punctuation">(</span>in_subroutine<span class="token punctuation">,</span> subroutine_parenthesis_stack<span class="token punctuation">)</span><span class="token punctuation">:</span>
                    instrumented_lines<span class="token punctuation">.</span>append<span class="token punctuation">(</span>get_syslog_line<span class="token punctuation">(</span>name<span class="token punctuation">,</span> sub_tested_line_numbers<span class="token punctuation">,</span> <span class="token number">2</span><span class="token punctuation">)</span><span class="token punctuation">)</span>
                    sub_tested_line_numbers <span class="token operator">=</span> <span class="token punctuation">[</span><span class="token punctuation">]</span>
                    in_subroutine <span class="token operator">=</span> <span class="token boolean">False</span>
                <span class="token keyword">elif</span> has_open_params<span class="token punctuation">(</span>is_tested<span class="token punctuation">,</span> stripped_line<span class="token punctuation">)</span><span class="token punctuation">:</span>
                    add_log_line<span class="token punctuation">(</span><span class="token punctuation">)</span>
                    subroutine_parenthesis_stack<span class="token punctuation">.</span>append<span class="token punctuation">(</span>original_line_count<span class="token punctuation">)</span>
            <span class="token keyword">elif</span> has_open_params<span class="token punctuation">(</span>is_tested<span class="token punctuation">,</span> stripped_line<span class="token punctuation">)</span><span class="token punctuation">:</span>  <span class="token comment"># is_open_parens</span>
                add_log_line<span class="token punctuation">(</span><span class="token punctuation">)</span>
                subroutine_parenthesis_stack<span class="token punctuation">.</span>append<span class="token punctuation">(</span>original_line_count<span class="token punctuation">)</span>
            <span class="token keyword">elif</span> is_return_line<span class="token punctuation">(</span>stripped_line<span class="token punctuation">)</span><span class="token punctuation">:</span>
                add_log_line<span class="token punctuation">(</span><span class="token punctuation">)</span>
                instrumented_lines<span class="token punctuation">.</span>append<span class="token punctuation">(</span>get_syslog_line<span class="token punctuation">(</span>name<span class="token punctuation">,</span> sub_tested_line_numbers<span class="token punctuation">,</span> l_ws_cou<span class="token punctuation">)</span><span class="token punctuation">)</span>
            <span class="token keyword">elif</span> is_tested<span class="token punctuation">:</span>
                add_log_line<span class="token punctuation">(</span><span class="token punctuation">)</span>

            instrumented_lines<span class="token punctuation">.</span>append<span class="token punctuation">(</span>raw_line<span class="token punctuation">)</span>

        original_line_count <span class="token operator">+=</span> <span class="token number">1</span>

    instrumented_content <span class="token operator">=</span> <span class="token string">'n'</span><span class="token punctuation">.</span>join<span class="token punctuation">(</span>instrumented_lines<span class="token punctuation">)</span>
    <span class="token keyword">return</span> instrumented_content<span class="token punctuation">,</span> original_line_count<span class="token punctuation">,</span> tested_line_numbers
It’s not important to understand exactly what’s going on here, except that we implemented the instrumentation behavior mentioned above.
Then, we store the instrumentation map, that will later allow us to process the logs to output an execution coverage of the source code:
instrumentation_mapping<span class="token punctuation">[</span>name<span class="token punctuation">]</span> <span class="token operator">=</span> <span class="token punctuation">{</span>  <span class="token comment"># Each key is a vcl file</span>
    <span class="token string">'original_content'</span><span class="token punctuation">:</span> original_vcl_source_code<span class="token punctuation">,</span>
    <span class="token string">'orig_line_count'</span><span class="token punctuation">:</span> original_vcl_line_count<span class="token punctuation">,</span>
    <span class="token string">'tested_line_count'</span><span class="token punctuation">:</span> amount_of_lines_we_tested<span class="token punctuation">,</span>  <span class="token comment"># Excluding empty lines, comments, etc..</span>
    <span class="token string">'tested_line_numbers'</span><span class="token punctuation">:</span> original_line_numbers_that_we_test
<span class="token punctuation">}</span>
3. Upload the instrumented code to Fastly
Clone our active Fastly service version:
<span class="token keyword">def</span> <span class="token function">clone_version</span><span class="token punctuation">(</span>service_id<span class="token punctuation">,</span> version<span class="token punctuation">)</span><span class="token punctuation">:</span>
    url <span class="token operator">=</span> <span class="token string">'https://api.fastly.com/service/{}/version/{}/clone'</span><span class="token punctuation">.</span><span class="token builtin">format</span><span class="token punctuation">(</span>service_id<span class="token punctuation">,</span> version<span class="token punctuation">)</span>
    response <span class="token operator">=</span> requests<span class="token punctuation">.</span>request<span class="token punctuation">(</span><span class="token string">'PUT'</span><span class="token punctuation">,</span> url<span class="token punctuation">,</span> headers<span class="token operator">=</span><span class="token punctuation">{</span><span class="token punctuation">.</span><span class="token punctuation">.</span><span class="token punctuation">.</span><span class="token punctuation">}</span><span class="token punctuation">)</span>
    <span class="token keyword">return</span> response<span class="token punctuation">.</span>json<span class="token punctuation">(</span><span class="token punctuation">)</span><span class="token punctuation">[</span><span class="token string">'number'</span><span class="token punctuation">]</span>
Replace the instrumented VCLs. For each VCL file:
<span class="token keyword">def</span> <span class="token function">delete_custom_vcl</span><span class="token punctuation">(</span>service_id<span class="token punctuation">,</span> version<span class="token punctuation">,</span> name<span class="token punctuation">)</span><span class="token punctuation">:</span>
    url <span class="token operator">=</span> <span class="token string">'https://api.fastly.com/service/{}/version/{}/vcl/{}'</span><span class="token punctuation">.</span><span class="token builtin">format</span><span class="token punctuation">(</span>service_id<span class="token punctuation">,</span> version<span class="token punctuation">,</span> name<span class="token punctuation">)</span>
    response <span class="token operator">=</span> requests<span class="token punctuation">.</span>request<span class="token punctuation">(</span><span class="token string">'DELETE'</span><span class="token punctuation">,</span> url<span class="token punctuation">,</span> headers<span class="token operator">=</span><span class="token punctuation">{</span><span class="token punctuation">.</span><span class="token punctuation">.</span><span class="token punctuation">.</span><span class="token punctuation">}</span><span class="token punctuation">)</span>

<span class="token keyword">def</span> <span class="token function">create_custom_vcl</span><span class="token punctuation">(</span>service_id<span class="token punctuation">,</span> version<span class="token punctuation">,</span> vcl_object<span class="token punctuation">)</span><span class="token punctuation">:</span>
    url <span class="token operator">=</span> <span class="token string">'https://api.fastly.com/service/{}/version/{}/vcl'</span><span class="token punctuation">.</span><span class="token builtin">format</span><span class="token punctuation">(</span>service_id<span class="token punctuation">,</span> version<span class="token punctuation">)</span>
    response <span class="token operator">=</span> requests<span class="token punctuation">.</span>request<span class="token punctuation">(</span><span class="token string">'POST'</span><span class="token punctuation">,</span> url<span class="token punctuation">,</span> headers<span class="token operator">=</span><span class="token punctuation">{</span><span class="token punctuation">.</span><span class="token punctuation">.</span><span class="token punctuation">.</span><span class="token punctuation">}</span><span class="token punctuation">,</span> data<span class="token operator">=</span>urlencode<span class="token punctuation">(</span>vcl_object<span class="token punctuation">)</span><span class="token punctuation">)</span>
Reserve a Ngrok TCP address (requires a premium Ngrok account – dashboard.ngrok.com/reserved)
In the formal version, we also support using an external proxy, like localtunnel, for the job.
Create a Fastly logging endpoint of type Syslog that points to the reserved TCP address:
<span class="token keyword">def</span> <span class="token function">create_syslog_endpoint</span><span class="token punctuation">(</span>service_id<span class="token punctuation">,</span> version<span class="token punctuation">)</span><span class="token punctuation">:</span>
	syslog_object <span class="token operator">=</span> <span class="token punctuation">{</span>
        <span class="token string">'name'</span><span class="token punctuation">:</span> <span class="token string">'<syslog_endpoint_name>'</span><span class="token punctuation">,</span>
        <span class="token string">'address'</span><span class="token punctuation">:</span> <span class="token string">'<reserved_tcp_address>'</span><span class="token punctuation">,</span>
        <span class="token string">'hostname'</span><span class="token punctuation">:</span> <span class="token string">'<reserved_tcp_address>'</span><span class="token punctuation">,</span>
        <span class="token string">'port'</span><span class="token punctuation">:</span> <span class="token operator"><</span>reserved_tcp_port<span class="token operator">></span><span class="token punctuation">,</span>
    <span class="token punctuation">}</span>
    url <span class="token operator">=</span> <span class="token string">'https://api.fastly.com/service/{}/version/{}/logging/syslog'</span><span class="token punctuation">.</span><span class="token builtin">format</span><span class="token punctuation">(</span>service_id<span class="token punctuation">,</span> version<span class="token punctuation">)</span>
    response <span class="token operator">=</span> requests<span class="token punctuation">.</span>request<span class="token punctuation">(</span><span class="token string">'POST'</span><span class="token punctuation">,</span> url<span class="token punctuation">,</span> headers<span class="token operator">=</span><span class="token punctuation">{</span><span class="token punctuation">.</span><span class="token punctuation">.</span><span class="token punctuation">.</span><span class="token punctuation">}</span><span class="token punctuation">,</span> data<span class="token operator">=</span>urlencode<span class="token punctuation">(</span>syslog_object<span class="token punctuation">)</span><span class="token punctuation">)</span>
Finally, activate the version:
<span class="token keyword">def</span> <span class="token function">activate_version</span><span class="token punctuation">(</span>service_id<span class="token punctuation">,</span> version<span class="token punctuation">)</span><span class="token punctuation">:</span>
    url <span class="token operator">=</span> <span class="token string">'https://api.fastly.com/service/{}/version/{}/activate'</span><span class="token punctuation">.</span><span class="token builtin">format</span><span class="token punctuation">(</span>service_id<span class="token punctuation">,</span> version<span class="token punctuation">)</span>
    response <span class="token operator">=</span> requests<span class="token punctuation">.</span>request<span class="token punctuation">(</span><span class="token string">'PUT'</span><span class="token punctuation">,</span> url<span class="token punctuation">,</span> headers<span class="token operator">=</span><span class="token punctuation">{</span><span class="token punctuation">.</span><span class="token punctuation">.</span><span class="token punctuation">.</span><span class="token punctuation">}</span><span class="token punctuation">)</span>
4. Listen for incoming logs
Let’s spin up a Ngrok and Syslog local instances, this can be easily done using docker straight from our python code using the docker (install with pip install docker) package:
<span class="token keyword">def</span> <span class="token function">run_syslog_server</span><span class="token punctuation">(</span>logs_path<span class="token punctuation">)</span><span class="token punctuation">:</span>
    client <span class="token operator">=</span> docker<span class="token punctuation">.</span>from_env<span class="token punctuation">(</span><span class="token punctuation">)</span>
    volumes <span class="token operator">=</span> <span class="token punctuation">[</span><span class="token string">'{}:/var/log'</span><span class="token punctuation">.</span><span class="token builtin">format</span><span class="token punctuation">(</span>logs_path<span class="token punctuation">)</span><span class="token punctuation">]</span>
    container_handle <span class="token operator">=</span> client<span class="token punctuation">.</span>containers<span class="token punctuation">.</span>run<span class="token punctuation">(</span>image<span class="token operator">=</span><span class="token string">'balabit/syslog-ng:latest'</span><span class="token punctuation">,</span> command<span class="token operator">=</span><span class="token string">'--no-caps'</span><span class="token punctuation">,</span> stdout<span class="token operator">=</span><span class="token boolean">True</span><span class="token punctuation">,</span>
                                             stderr<span class="token operator">=</span><span class="token boolean">True</span><span class="token punctuation">,</span> remove<span class="token operator">=</span><span class="token boolean">True</span><span class="token punctuation">,</span> detach<span class="token operator">=</span><span class="token boolean">True</span><span class="token punctuation">,</span> volumes<span class="token operator">=</span>volumes<span class="token punctuation">,</span>
                                             name<span class="token operator">=</span><span class="token string">'instrumentation-syslog-ng'</span><span class="token punctuation">)</span>
    <span class="token keyword">return</span> container_handle

<span class="token keyword">def</span> <span class="token function">run_ngrok</span><span class="token punctuation">(</span>auth_token<span class="token punctuation">,</span> remote_addr<span class="token punctuation">)</span><span class="token punctuation">:</span>
    client <span class="token operator">=</span> docker<span class="token punctuation">.</span>from_env<span class="token punctuation">(</span><span class="token punctuation">)</span>
    syslog_name <span class="token operator">=</span> <span class="token string">'instrumentation-syslog-ng'</span>
    command <span class="token operator">=</span> <span class="token string">'ngrok tcp --authtoken {} --remote-addr {}:{} {}:514'</span><span class="token punctuation">.</span><span class="token builtin">format</span><span class="token punctuation">(</span>auth_token<span class="token punctuation">,</span> remote_addr<span class="token punctuation">[</span><span class="token number">0</span><span class="token punctuation">]</span><span class="token punctuation">,</span> remote_addr<span class="token punctuation">[</span><span class="token number">1</span><span class="token punctuation">]</span><span class="token punctuation">,</span>
                                                                           syslog_name<span class="token punctuation">)</span>
    links <span class="token operator">=</span> <span class="token punctuation">{</span>syslog_name<span class="token punctuation">:</span> syslog_name<span class="token punctuation">}</span>
    container_handle <span class="token operator">=</span> client<span class="token punctuation">.</span>containers<span class="token punctuation">.</span>run<span class="token punctuation">(</span>image<span class="token operator">=</span><span class="token string">'wernight/ngrok:latest'</span><span class="token punctuation">,</span> command<span class="token operator">=</span>command<span class="token punctuation">,</span> stdout<span class="token operator">=</span><span class="token boolean">True</span><span class="token punctuation">,</span>
                                             stderr<span class="token operator">=</span><span class="token boolean">True</span><span class="token punctuation">,</span> remove<span class="token operator">=</span><span class="token boolean">True</span><span class="token punctuation">,</span> detach<span class="token operator">=</span><span class="token boolean">True</span><span class="token punctuation">,</span> links<span class="token operator">=</span>links<span class="token punctuation">,</span>
                                             name<span class="token operator">=</span><span class="token string">'instrumentation-ngrok'</span><span class="token punctuation">)</span>
    <span class="token keyword">return</span> container_handle
The run_syslog_server subroutine receives a logs_path parameter that we used as the volume target on our host to receive the logs from the syslog server container.
The run_ngrok subroutine forwards all incoming traffic to the instrumentation-syslog-ng hostname, that is our syslog server container hostname.
5. Run your tests on the Fastly service endpoint
Now, we simply run the End-to-End tests on the Fastly service endpoint. The logs will be forwarded to the logs_path on our machine.
6. Process the logs
The logs are lines of the form:
<code class="language-text">Feb 28 13:46:05 cache-fra19141 Px-Instrumentation[380410]: main,4 8To process them, we create a unique set of line numbers (4, 8) per vcl file name (main). Then, we calculate the report using the following subroutine (where processed_logs is the unique set and instrumentation_mapping is the mapping we computed earlier):
<span class="token keyword">def</span> <span class="token function">calculate_coverage</span><span class="token punctuation">(</span>instrumentation_mappings<span class="token punctuation">,</span> processed_logs<span class="token punctuation">)</span><span class="token punctuation">:</span>
    <span class="token triple-quoted-string string">"""
    Given the parameters, returns a coverage object that contains the needed data for the report
    :param dict instrumentation_mappings: a dictionary of
    key: name, value: properties that includes instrumentation mappings
    :param list processed_logs: a list of processed logs that contain the coverage information
    :return dict: coverage object
    """</span>
    coverage_object <span class="token operator">=</span> <span class="token punctuation">{</span><span class="token punctuation">}</span>
    files <span class="token operator">=</span> <span class="token punctuation">{</span><span class="token punctuation">}</span>
    global_tested_line_count <span class="token operator">=</span> <span class="token number">0</span>
    global_covered_line_count <span class="token operator">=</span> <span class="token number">0</span>
    <span class="token keyword">for</span> name<span class="token punctuation">,</span> vcl_mapping <span class="token keyword">in</span> instrumentation_mappings<span class="token punctuation">.</span>items<span class="token punctuation">(</span><span class="token punctuation">)</span><span class="token punctuation">:</span>
        tested_line_count <span class="token operator">=</span> vcl_mapping<span class="token punctuation">[</span><span class="token string">'tested_line_count'</span><span class="token punctuation">]</span>
        original_content <span class="token operator">=</span> vcl_mapping<span class="token punctuation">[</span><span class="token string">'original_content'</span><span class="token punctuation">]</span>
        logs <span class="token operator">=</span> logs_by_name_line<span class="token punctuation">[</span><span class="token builtin">str</span><span class="token punctuation">(</span>vcl_mapping<span class="token punctuation">[</span><span class="token string">'name_mapping'</span><span class="token punctuation">]</span><span class="token punctuation">)</span><span class="token punctuation">]</span>
        covered_line_numbers <span class="token operator">=</span> logs<span class="token punctuation">.</span>keys<span class="token punctuation">(</span><span class="token punctuation">)</span>
        covered_line_count <span class="token operator">=</span> <span class="token builtin">len</span><span class="token punctuation">(</span>logs<span class="token punctuation">)</span>
        tested_line_numbers <span class="token operator">=</span> vcl_mapping<span class="token punctuation">[</span><span class="token string">'tested_line_numbers'</span><span class="token punctuation">]</span>
        uncovered_line_numbers <span class="token operator">=</span> <span class="token punctuation">[</span>line <span class="token keyword">for</span> line <span class="token keyword">in</span> tested_line_numbers <span class="token keyword">if</span> line <span class="token keyword">not</span> <span class="token keyword">in</span> covered_line_numbers<span class="token punctuation">]</span>
        files<span class="token punctuation">[</span>name<span class="token punctuation">]</span> <span class="token operator">=</span> <span class="token punctuation">{</span>
            <span class="token string">'name'</span><span class="token punctuation">:</span> name<span class="token punctuation">,</span>
            <span class="token string">'coverage_line_percentage'</span><span class="token punctuation">:</span> calc_percentage<span class="token punctuation">(</span>covered_line_count<span class="token punctuation">,</span> tested_line_count<span class="token punctuation">)</span><span class="token punctuation">,</span>
            <span class="token string">'covered_line_count'</span><span class="token punctuation">:</span> covered_line_count<span class="token punctuation">,</span>
            <span class="token string">'tested_line_count'</span><span class="token punctuation">:</span> tested_line_count<span class="token punctuation">,</span>
            <span class="token string">'total_line_count'</span><span class="token punctuation">:</span> <span class="token builtin">len</span><span class="token punctuation">(</span>original_content<span class="token punctuation">.</span>split<span class="token punctuation">(</span><span class="token string">'n'</span><span class="token punctuation">)</span><span class="token punctuation">)</span><span class="token punctuation">,</span>
            <span class="token string">'original_content'</span><span class="token punctuation">:</span> original_content<span class="token punctuation">,</span>
            <span class="token string">'tested_line_numbers'</span><span class="token punctuation">:</span> tested_line_numbers<span class="token punctuation">,</span>
            <span class="token string">'uncovered_line_numbers'</span><span class="token punctuation">:</span> uncovered_line_numbers<span class="token punctuation">,</span>
            <span class="token string">'covered_line_numbers'</span><span class="token punctuation">:</span> covered_line_numbers
        <span class="token punctuation">}</span>
        global_tested_line_count <span class="token operator">+=</span> tested_line_count
        global_covered_line_count <span class="token operator">+=</span> covered_line_count
    coverage_object<span class="token punctuation">[</span><span class="token string">'files'</span><span class="token punctuation">]</span> <span class="token operator">=</span> files
    <span class="token keyword">return</span> coverage_object
For each VCL file, we compute the following statistics:
coverage_line_percentage: the percentage of lines we covered out of the total tested linescovered_line_count: the number of lines we coveredtested_line_count: the number of lines we testoriginal_content: the original vcl file stringtested_line_numbers: the line numbers that were testeduncovered_line_numbers: the line numbers that were not coveredcovered_line_numbers: the line numbers that were covered
7. Generate an HTML report
We now have all the information we need to generate an exact line coverage report.
<span class="token keyword">from</span> pygments <span class="token keyword">import</span> highlight
<span class="token keyword">from</span> pygments<span class="token punctuation">.</span>lexers <span class="token keyword">import</span> get_lexer_by_name
<span class="token keyword">from</span> pygments<span class="token punctuation">.</span>formatters <span class="token keyword">import</span> HtmlFormatter

<span class="token keyword">def</span> <span class="token function">generate_html_report</span><span class="token punctuation">(</span>coverage_object<span class="token punctuation">)</span><span class="token punctuation">:</span>
    <span class="token triple-quoted-string string">"""
    Given a coverage object returns an html report
    :param dict coverage_object:
    :return list(string), string: html files, css file
    """</span>
    lexer <span class="token operator">=</span> get_lexer_by_name<span class="token punctuation">(</span><span class="token string">'ruby'</span><span class="token punctuation">,</span> stripall<span class="token operator">=</span><span class="token boolean">True</span><span class="token punctuation">)</span>
    formatter <span class="token operator">=</span> HtmlFormatter<span class="token punctuation">(</span>linenos<span class="token operator">=</span><span class="token boolean">True</span><span class="token punctuation">,</span> cssclass<span class="token operator">=</span><span class="token string">'source'</span><span class="token punctuation">)</span>
    source_code_template <span class="token operator">=</span> fs_util<span class="token punctuation">.</span>read_file<span class="token punctuation">(</span>path<span class="token punctuation">.</span>join<span class="token punctuation">(</span>CUR_DIR<span class="token punctuation">,</span> <span class="token string">'..'</span><span class="token punctuation">,</span> <span class="token string">'assets'</span><span class="token punctuation">,</span> <span class="token string">'instrumentation'</span><span class="token punctuation">,</span> <span class="token string">'code_cover.jinja2'</span><span class="token punctuation">)</span><span class="token punctuation">)</span>
    html_files <span class="token operator">=</span> <span class="token punctuation">{</span><span class="token punctuation">}</span>
    file_names <span class="token operator">=</span> coverage_object<span class="token punctuation">[</span><span class="token string">'files'</span><span class="token punctuation">]</span><span class="token punctuation">.</span>keys<span class="token punctuation">(</span><span class="token punctuation">)</span>
    <span class="token keyword">for</span> file_name<span class="token punctuation">,</span> file_coverage <span class="token keyword">in</span> coverage_object<span class="token punctuation">[</span><span class="token string">'files'</span><span class="token punctuation">]</span><span class="token punctuation">.</span>items<span class="token punctuation">(</span><span class="token punctuation">)</span><span class="token punctuation">:</span>
        source <span class="token operator">=</span> highlight<span class="token punctuation">(</span>file_coverage<span class="token punctuation">[</span><span class="token string">'original_content'</span><span class="token punctuation">]</span><span class="token punctuation">,</span> lexer<span class="token punctuation">,</span> formatter<span class="token punctuation">)</span>
        source_lines <span class="token operator">=</span> source<span class="token punctuation">.</span>split<span class="token punctuation">(</span><span class="token string">'n'</span><span class="token punctuation">)</span>
        <span class="token comment"># find the start of the code</span>
        indices <span class="token operator">=</span> <span class="token punctuation">[</span>i <span class="token keyword">for</span> <span class="token punctuation">(</span>i<span class="token punctuation">,</span> line<span class="token punctuation">)</span> <span class="token keyword">in</span> <span class="token builtin">enumerate</span><span class="token punctuation">(</span>source_lines<span class="token punctuation">)</span> <span class="token keyword">if</span> <span class="token string">'<td class="code"><div class="source"><pre>'</span> <span class="token keyword">in</span> line<span class="token punctuation">]</span>
        <span class="token keyword">if</span> <span class="token builtin">len</span><span class="token punctuation">(</span>indices<span class="token punctuation">)</span> <span class="token operator">!=</span> <span class="token number">1</span><span class="token punctuation">:</span>
            <span class="token keyword">raise</span> Exception<span class="token punctuation">(</span><span class="token string">'No suitable pre code entries found'</span><span class="token punctuation">)</span>
        uncovered_line_numbers_offset <span class="token operator">=</span> <span class="token punctuation">[</span>indices<span class="token punctuation">[</span><span class="token number">0</span><span class="token punctuation">]</span> <span class="token operator">+</span> i <span class="token operator">-</span> <span class="token number">1</span> <span class="token keyword">for</span> i <span class="token keyword">in</span> file_coverage<span class="token punctuation">[</span><span class="token string">'uncovered_line_numbers'</span><span class="token punctuation">]</span><span class="token punctuation">]</span>
        <span class="token keyword">for</span> i <span class="token keyword">in</span> uncovered_line_numbers_offset<span class="token punctuation">:</span>
            source_lines<span class="token punctuation">[</span>i<span class="token punctuation">]</span> <span class="token operator">=</span> <span class="token string">'<span class="uncovered">{}</span>'</span><span class="token punctuation">.</span><span class="token builtin">format</span><span class="token punctuation">(</span>source_lines<span class="token punctuation">[</span>i<span class="token punctuation">]</span><span class="token punctuation">)</span>
        covered_line_numbers_offset <span class="token operator">=</span> <span class="token punctuation">[</span>indices<span class="token punctuation">[</span><span class="token number">0</span><span class="token punctuation">]</span> <span class="token operator">+</span> i <span class="token operator">-</span> <span class="token number">1</span> <span class="token keyword">for</span> i <span class="token keyword">in</span> file_coverage<span class="token punctuation">[</span><span class="token string">'covered_line_numbers'</span><span class="token punctuation">]</span><span class="token punctuation">]</span>
        <span class="token keyword">for</span> i <span class="token keyword">in</span> covered_line_numbers_offset<span class="token punctuation">:</span>
            source_lines<span class="token punctuation">[</span>i<span class="token punctuation">]</span> <span class="token operator">=</span> <span class="token string">'<span class="covered">{}</span>'</span><span class="token punctuation">.</span><span class="token builtin">format</span><span class="token punctuation">(</span>source_lines<span class="token punctuation">[</span>i<span class="token punctuation">]</span><span class="token punctuation">)</span>
        source <span class="token operator">=</span> <span class="token string">'n'</span><span class="token punctuation">.</span>join<span class="token punctuation">(</span>source_lines<span class="token punctuation">)</span>
        result <span class="token operator">=</span> string_util<span class="token punctuation">.</span>render_template_with_variables<span class="token punctuation">(</span>source_code_template<span class="token punctuation">,</span> <span class="token punctuation">{</span>
            <span class="token string">'title'</span><span class="token punctuation">:</span> <span class="token string">'{}.vcl'</span><span class="token punctuation">.</span><span class="token builtin">format</span><span class="token punctuation">(</span>file_name<span class="token punctuation">)</span><span class="token punctuation">,</span>
            <span class="token string">'file_names'</span><span class="token punctuation">:</span> file_names<span class="token punctuation">,</span>
            <span class="token string">'file'</span><span class="token punctuation">:</span> file_coverage<span class="token punctuation">,</span>
            <span class="token string">'source'</span><span class="token punctuation">:</span> source
        <span class="token punctuation">}</span><span class="token punctuation">)</span>
        html_files<span class="token punctuation">[</span>file_name<span class="token punctuation">]</span> <span class="token operator">=</span> result
    <span class="token keyword">return</span> html_files
And the jinja2 template we are using for generating the coverage report:
<span class="token doctype"><span class="token punctuation"><!</span><span class="token doctype-tag">DOCTYPE</span> <span class="token name">html</span><span class="token punctuation">></span></span>
<span class="token tag"><span class="token tag"><span class="token punctuation"><</span>html</span> <span class="token attr-name">lang</span><span class="token attr-value"><span class="token punctuation attr-equals">=</span><span class="token punctuation">"</span>en<span class="token punctuation">"</span></span><span class="token punctuation">></span></span>
  <span class="token tag"><span class="token tag"><span class="token punctuation"><</span>head</span><span class="token punctuation">></span></span>
    <span class="token tag"><span class="token tag"><span class="token punctuation"><</span>meta</span> <span class="token attr-name">charset</span><span class="token attr-value"><span class="token punctuation attr-equals">=</span><span class="token punctuation">"</span>UTF-8<span class="token punctuation">"</span></span> <span class="token punctuation">/></span></span>
    <span class="token tag"><span class="token tag"><span class="token punctuation"><</span>title</span><span class="token punctuation">></span></span>{{ title }}<span class="token tag"><span class="token tag"><span class="token punctuation"></</span>title</span><span class="token punctuation">></span></span>
    <span class="token tag"><span class="token tag"><span class="token punctuation"><</span>link</span> <span class="token attr-name">rel</span><span class="token attr-value"><span class="token punctuation attr-equals">=</span><span class="token punctuation">"</span>stylesheet<span class="token punctuation">"</span></span> <span class="token attr-name">type</span><span class="token attr-value"><span class="token punctuation attr-equals">=</span><span class="token punctuation">"</span>text/css<span class="token punctuation">"</span></span> <span class="token attr-name">href</span><span class="token attr-value"><span class="token punctuation attr-equals">=</span><span class="token punctuation">"</span>highlight.css<span class="token punctuation">"</span></span> <span class="token punctuation">/></span></span>
  <span class="token tag"><span class="token tag"><span class="token punctuation"></</span>head</span><span class="token punctuation">></span></span>
  <span class="token tag"><span class="token tag"><span class="token punctuation"><</span>body</span><span class="token punctuation">></span></span>
    <span class="token tag"><span class="token tag"><span class="token punctuation"><</span>div</span> <span class="token attr-name">class</span><span class="token attr-value"><span class="token punctuation attr-equals">=</span><span class="token punctuation">"</span>header<span class="token punctuation">"</span></span><span class="token punctuation">></span></span>
      <span class="token tag"><span class="token tag"><span class="token punctuation"><</span>h2</span><span class="token punctuation">></span></span>{{ title }}<span class="token tag"><span class="token tag"><span class="token punctuation"></</span>h2</span><span class="token punctuation">></span></span>
      <span class="token tag"><span class="token tag"><span class="token punctuation"><</span>p</span> <span class="token attr-name">class</span><span class="token attr-value"><span class="token punctuation attr-equals">=</span><span class="token punctuation">"</span>stats<span class="token punctuation">"</span></span><span class="token punctuation">></span></span>
        {{ file['coverage_line_percentage'] }}% Lines ({{ file['covered_line_count'] }}/{{ file['tested_line_count'] }})
      <span class="token tag"><span class="token tag"><span class="token punctuation"></</span>p</span><span class="token punctuation">></span></span>
    <span class="token tag"><span class="token tag"><span class="token punctuation"></</span>div</span><span class="token punctuation">></span></span>
    {{ source }}
  <span class="token tag"><span class="token tag"><span class="token punctuation"></</span>body</span><span class="token punctuation">></span></span>
<span class="token tag"><span class="token tag"><span class="token punctuation"></</span>html</span><span class="token punctuation">></span></span>
We decided to use the great package pygments (install with pip install pygments) to highlight our code along with neat line numbers beside them. Notice that we used the ruby lexer since it’s (somewhat) similar in syntax. Then, we find the lines that were covered/uncovered and inject a <span> element that will color them appropriately using CSS rules.
That’s it!
When we open the resulting HTML file we can see our coverage like in the original example:

Summary
In this post, we’ve learned what instrumentation is, how to apply it in special environments and went through an end-to-end implementation of an instrumentation mechanism for producing code coverage reporting for the VCL language on top of the Fastly Platform.
We can apply this method for every environment out there and get insights into our code during runtime.
We open sourced the tool, that currently supports Fastly VCL environments, and we plan to extend it to other environments that need instrumentation and code coverage. Feel free to use the tool, explore the code and contribute!