
Last month we hit a big milestone for HUMAN – over 6,000,000,000 page views per day! To help you get a better sense of what this means for us here are some more interesting numbers from our infrastructure monitoring:
- Dozens of zones in nine regions around the world
- Hundreds of thousands of payloads processed per second on a daily basis.
- ~24k cores and ~60Tb of RAM crunching away at the onslaught of traffic
- 70TB of raw data ingested every day
- More than 150 services deployed on a daily basis
Over the last three years, we have learned a lot about how to improve on our DevOps practices. It’s been a fascinating journey, and we would like to share a few of the things we found useful that are somewhat overlooked in other scaling literature. While this is in no way a complete list of cloud Devops practices, we are sure you will appreciate a smaller set of more easily digestible practices than a 10 page process definition ;). With that in mind, let’s jump right in!
Measure Your System and Present it in Flows
As we’ve posted in the past, we are big fans of Prometheus. We collect a boat load of metrics – from host level metrics, through container and application metrics all the way through to cloud / provider metrics. Grafana brings it all together for us in the UI. While we started to build our dashboards by service, we found that keeping the big picture in the back of our minds was a bit of a strain at 2am incidents when you have more than 150 services. To help ease this pain we started putting together aggregate dashboards which better depict the flow and dependencies between the various services. We found these to be more readable and better reflect the overall system status when an alert wakes you up in the middle of the night.
So what are flow dashboards all about? Let’s say you have service A. Service B is using service A, and service C is using Service B. you can build three dashboards for each service, but you have to build one dashboard for this specific flow. So when service A has an issue, you know much faster what is the impact on the system and which components are affected. As an example, the following is one such dashboard depicting a certain part of our system which has it’s input starts at an HTTPS endpoint and funnels through a few queue based systems all the way to BigQuery and Elasticsearch.
When woken up by a barrage of alerts around lack of information in a few systems, you can go over each service, (10-12 in our case) or you can take a look at this and immediately see where information is backing up and where you most probably need to dive into the problem.
, logstash instances were turned off, causing a decrease in Elasticsearch indexing rate. In the dashboard, we can notice immediately which component is broken.](https://assets.perimeterx.com/image/upload/v1574268533/blog/2019/six-billion-shades-of-scale/six-shades-of-scale-1_jyjsfy.png)
Scaling in the Cloud isn’t Always That Straight Forward
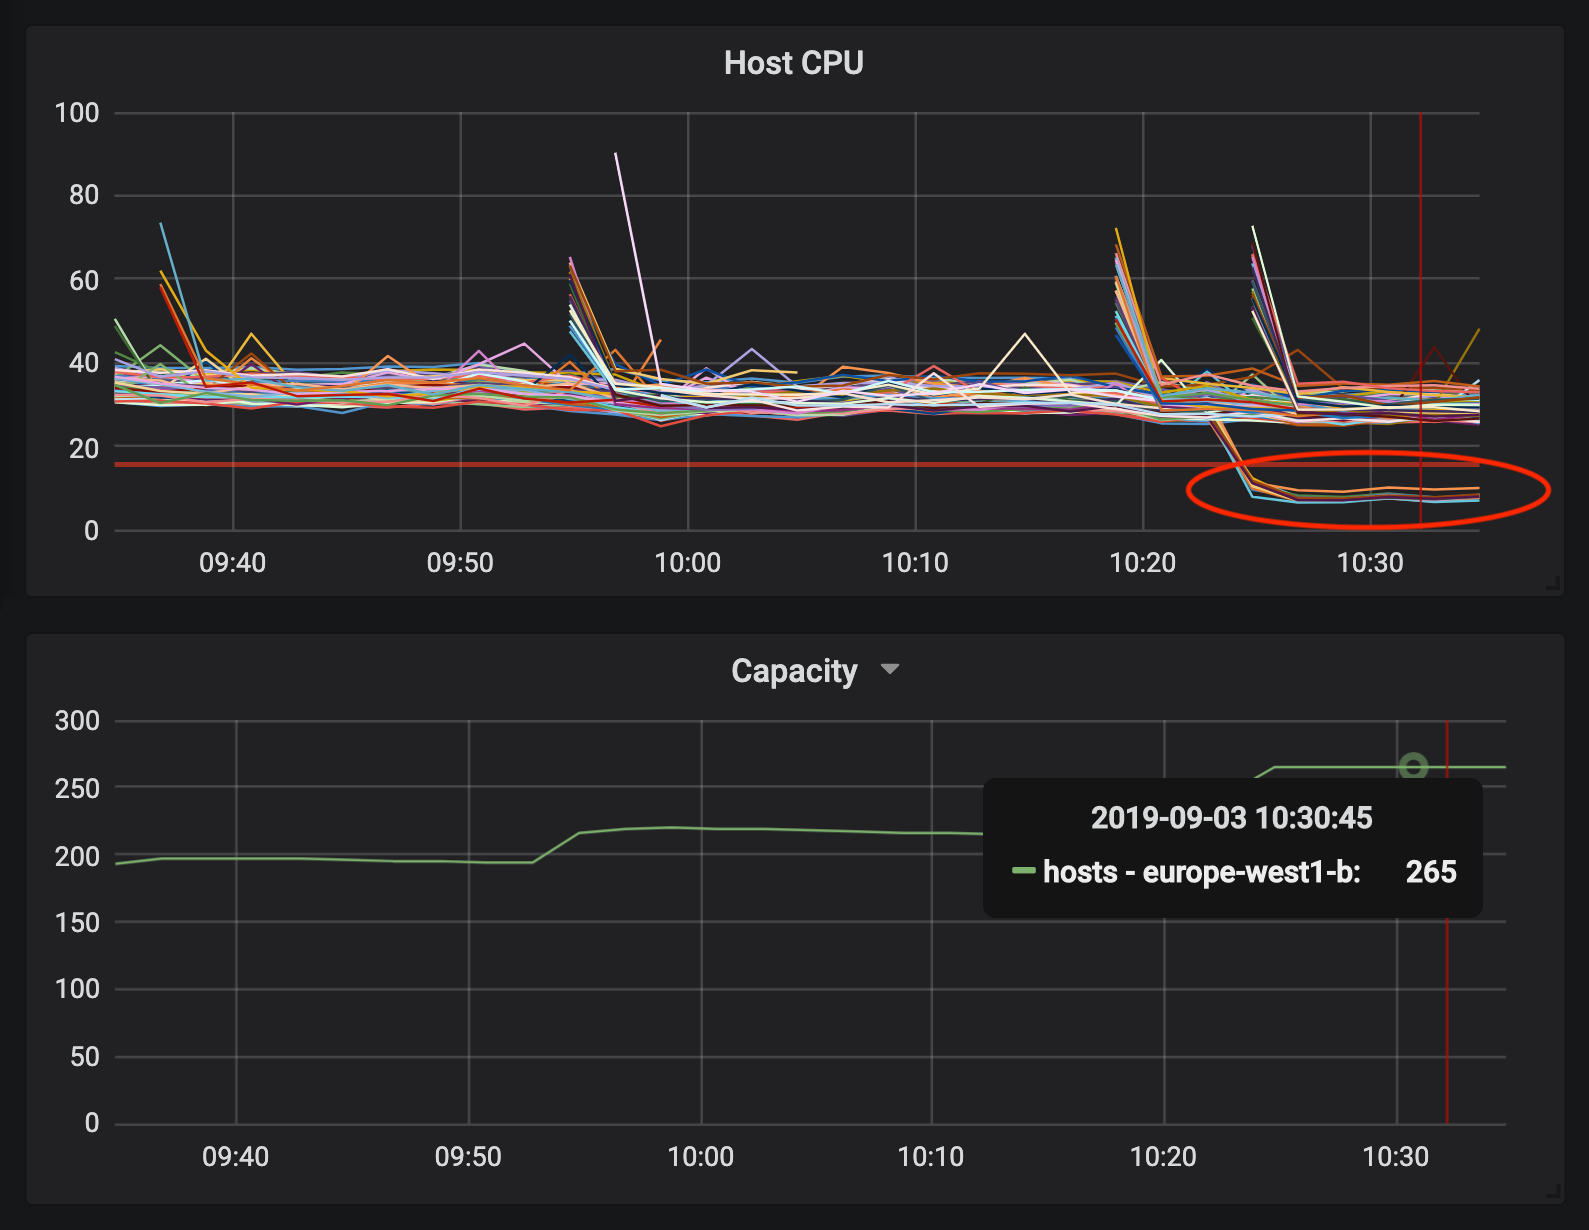
“The cloud is elastic” they said, “it’ll be ok” they said…while this is mostly true, the devil is in the details. Yes, you can pretty much spin up as many cores and ram as your bank account will let you (more if you’re not careful, but that is a whole different set of blogs ;)). BUT, there are always limits. At the end of the day, cloud based services are very similar to the service that you build in that they are built by engineers to withstand requirements laid out by their product managers. Those requirements had certain conditions and agreed upon limitations. Whether those were put there due to implementation details or more human issues such as fair use policies is besides the point, at the end of the day, they are there and they will end up affecting you at some point or another. Before you start using a service or API, we urge you to give the documentation a thorough read and make sure you take special note of the various quotas and limits section.
One such example we overlooked was around networking limits. If you are a GCP customer such as ourselves and make use of their load balancing service you are either aware of or need to take note of the following limit: “Maximum number of VM instances per internal backend service – 250 – This limit cannot be increased”. Yes, you read that right “This limit cannot be increased”. This isn’t a quota you can just increase, it is a rigid system limit (trust us, we tried). We found this out the hard way, when half way through peak traffic, additional hosts we autoscaled into the instance group were not getting any traffic. Resolving this is insanely simple, not to mention the fact that it can be achieved in more than one way (increasing the node sizes or introducing multiple backends just to name a couple). But you really don’t want to solve these things at peak traffic hours.
These kinds of limitations exist everywhere, AWS has a similar set of load balancing limitations, Bigquery has others. Once we started paying these special attention our cloud journey became that much simpler and smoother.
Floodgates, Circuit Breakers and Filters, Oh My
Every service in your system is liable to fail at one point or another. Even if it’s “fully redundant” and “highly available”, entire services can be down for many reasons, including those run by the largest corporations. One of the most useful patterns to handle high load and service disturbance issues is to simply avoid the requested work (kinda like we all want to do after lunch…). The common name for this design pattern is called a circuit breaker, seeing as it works similar to your common household circuit breaker.
Over the years, we’ve built mechanisms that can mitigate issues a service encounters. One of the most powerful available to us is to filter out (think of it as an implementation of a flood gate or a circuit breaker) – the ability to decrease load on the service i.e. drop some data / processing, which is less critical, and doesn’t affect our SLAs. The more interesting implementation, which greatly improved our service, is to offload large parts of the executed code for later processing.
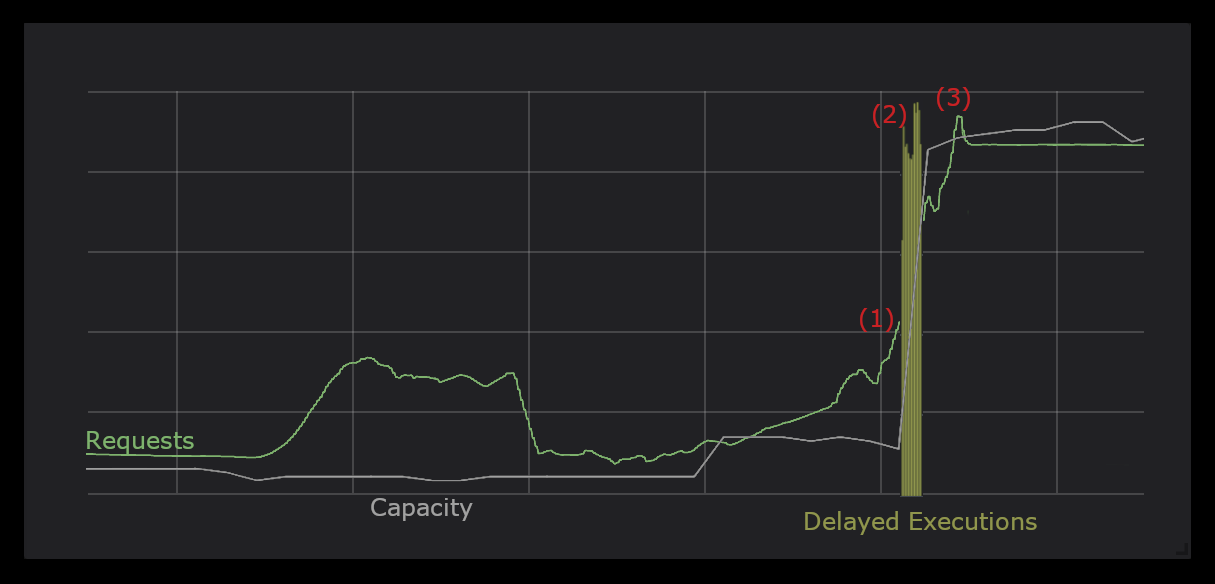
One such example can be observed below in Chart III. In this particular case you can see how a traffic spike (1) occurred in a specific service. Due to this the service got overloaded and to compensate, some of the processing was offloaded to a leaner service which delays execution (2) of certain aspects of the system which are not deemed as critical but more as “best to have these online, but ok if they are delayed by a few minutes every once in a while”. Once autoscaling kicked in (3) the delayed execution stopped.
The more services that have these kind of capabilities, the more you can break your pipelines in various stages with very little impact on production.
DevOps (the mindset, not the buzzword)
There are a lot of opinions regarding DevOps out there. One thing is for sure – the mindset needs to be everywhere. Over the years, we realized that we need to make DevOps more accessible to our teams in the company, not just the tooling, but the understanding of how stuff ends up running in production when it hits that error and you need to figure out what happened. Or when it gets too much pressure and scaling out just wasn’t properly considered. Product and engineering should take these aspects into consideration when planning a new feature. The customer onboarding team should be aware of system limitations when they deliver our products to a new customer and everyone needs to work together to find the best solutions in a timely fashion.
If you are interested in hearing more about how we are able to handle all of this you are more than welcome to reach out to us.